We constantly improve our platform, update existing features, and update the platform with new features. But what did we improve in January?
What's new:
Important: radar@30mhz.com not active
Week numbers visible in charts
Week numbers in datepicker in Explore
Plot more data in your charts
New weather forecast provider, Meteomatics!
Important: radar@30mhz.com not active
First an important message for users that have set their own systems for the 30MHz notifications with the e-mail address radar@30mhz.com. This e-mail address is not active anymore. The new e-mail address is no-reply@30mhz.com. All notification e-mails will be sent from no-reply@30mhz.com.
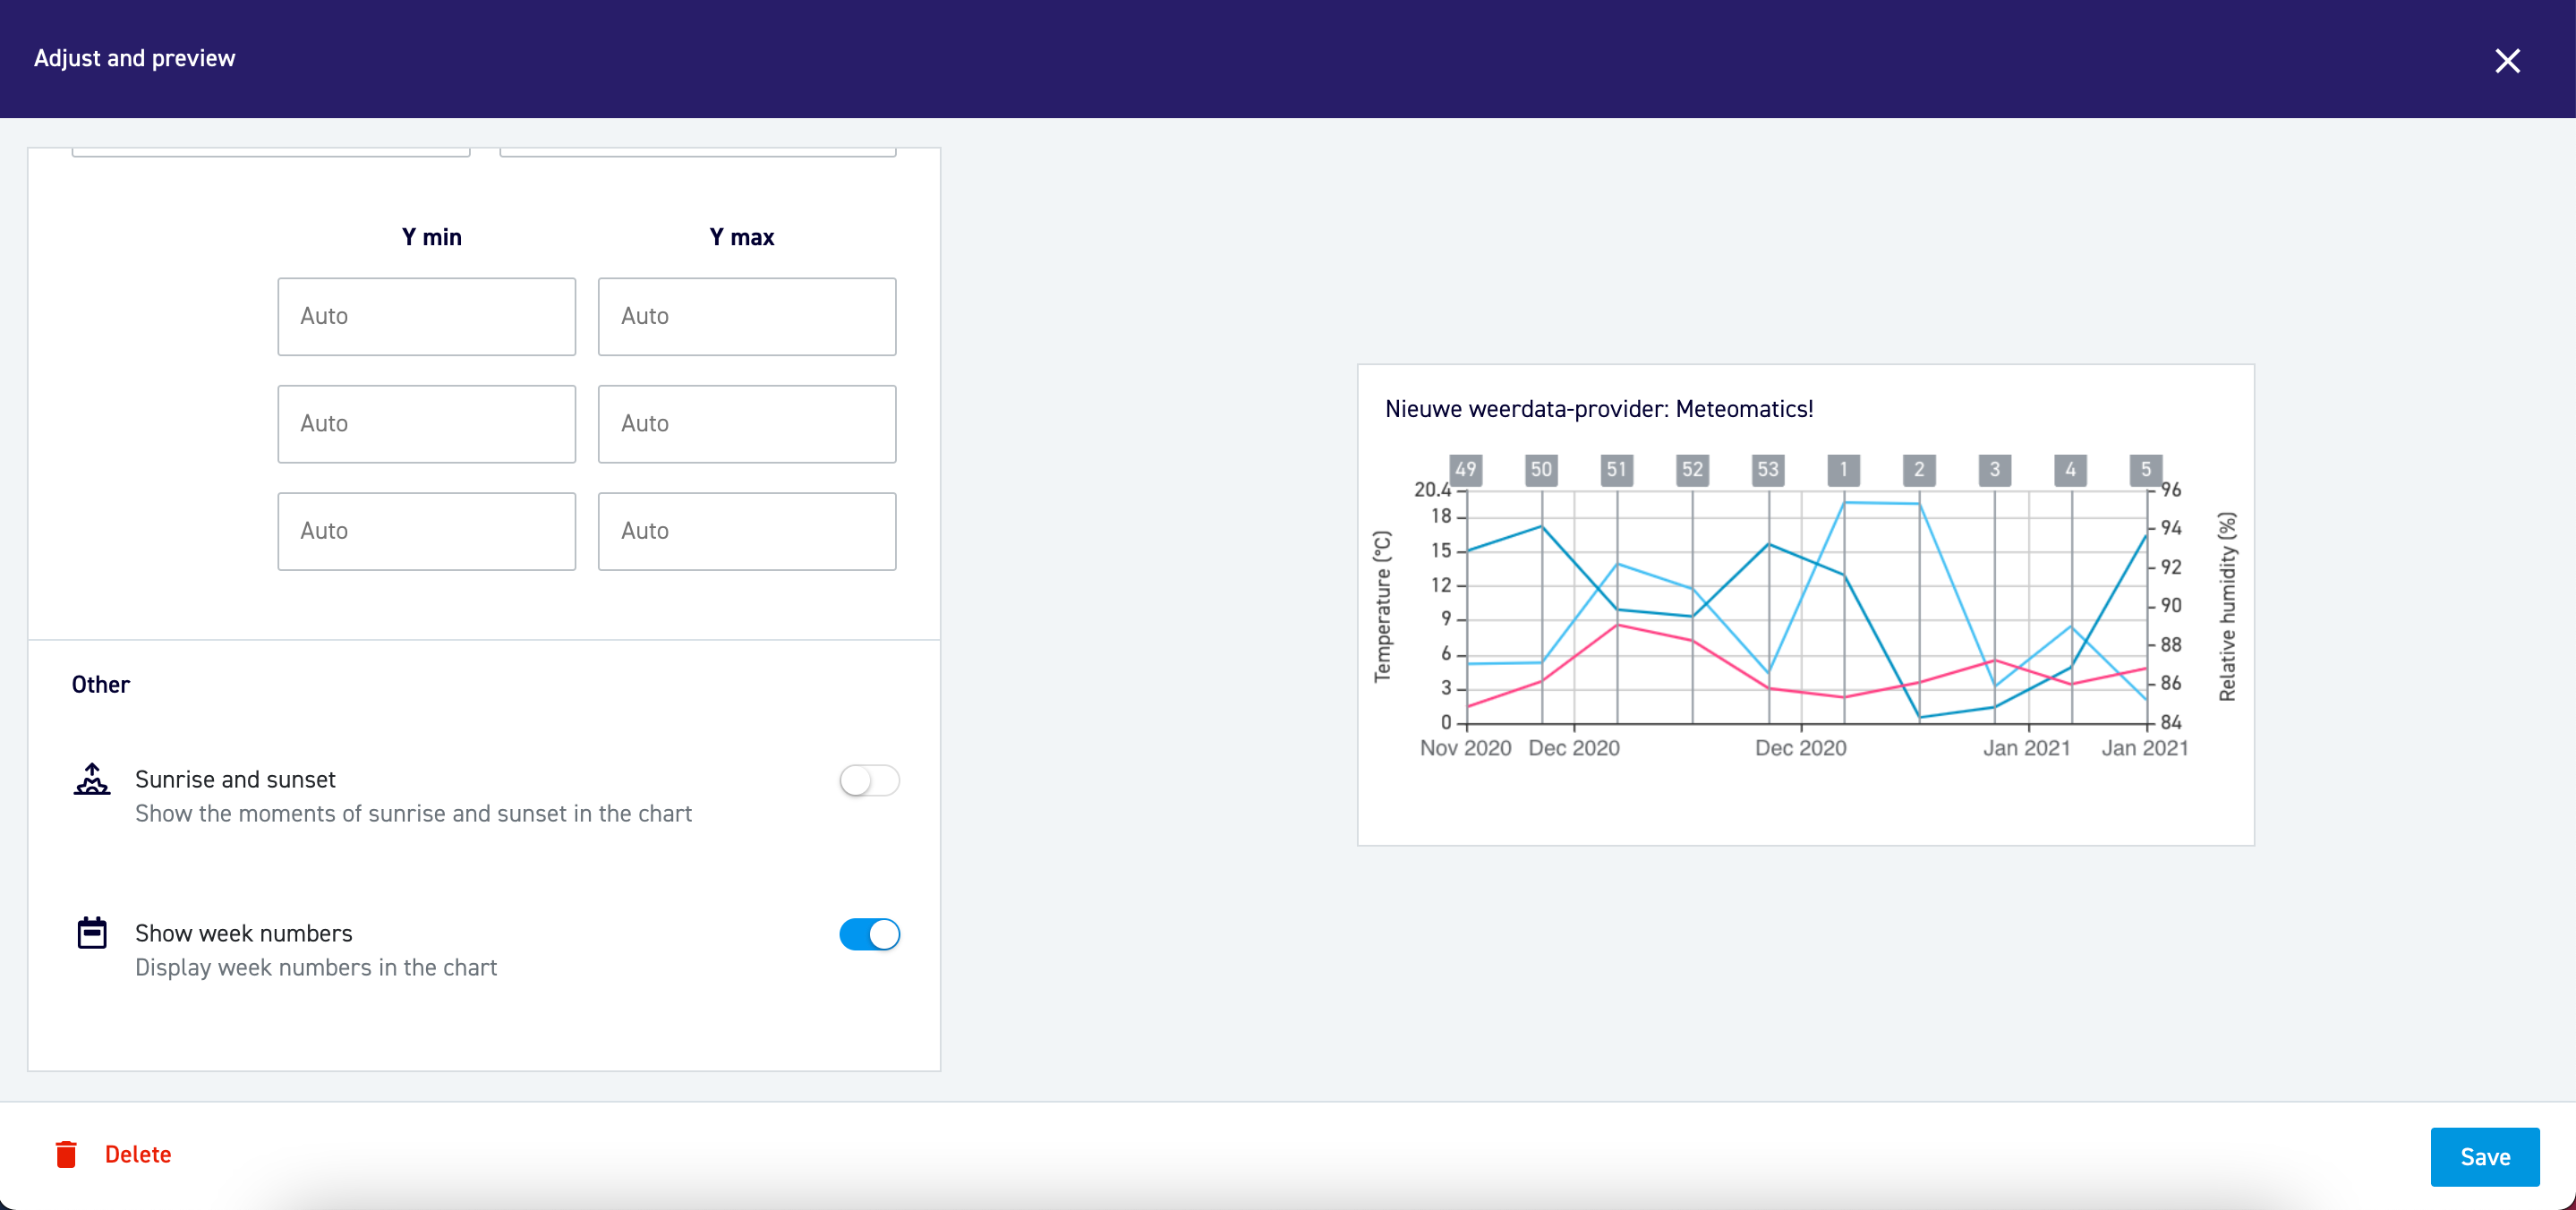
Week numbers visible in charts
We know a lot of you are using week numbers, so we can make you happy with the following update. It's now possible to show the week numbers in a line chart and bar chart. This feature might make it easier to analyse your data. Do you want to add the week numbers to your charts? Take the following steps:
When creating a new widget:
- Go to Dashboard via the main menu
- Ga to the dashboard that you would like to adjust
- Click on + Add widget
- Create a line chart or bar chart
- Adjust the settings to your preferences
- Scroll down to Other
- Activate Show week numbers by clicking on the switch
- Click on Create to add the widget to your dashboard
When adjusting an existing widget:
- Go to Dashboard via the main menu
- Ga to the dashboard that you would like to adjust
- Hoover on top of the chart and click on the edit button/pencil that appeared
- Scroll down to Other
- Activate Show week numbers by clicking on the switch
- Click on Save to adjust the widget
For Group users: week numbers can only be added to your chart with the Chart options button in Explore. Week numbers are not available while creating or adjusting widgets in the dashboards.
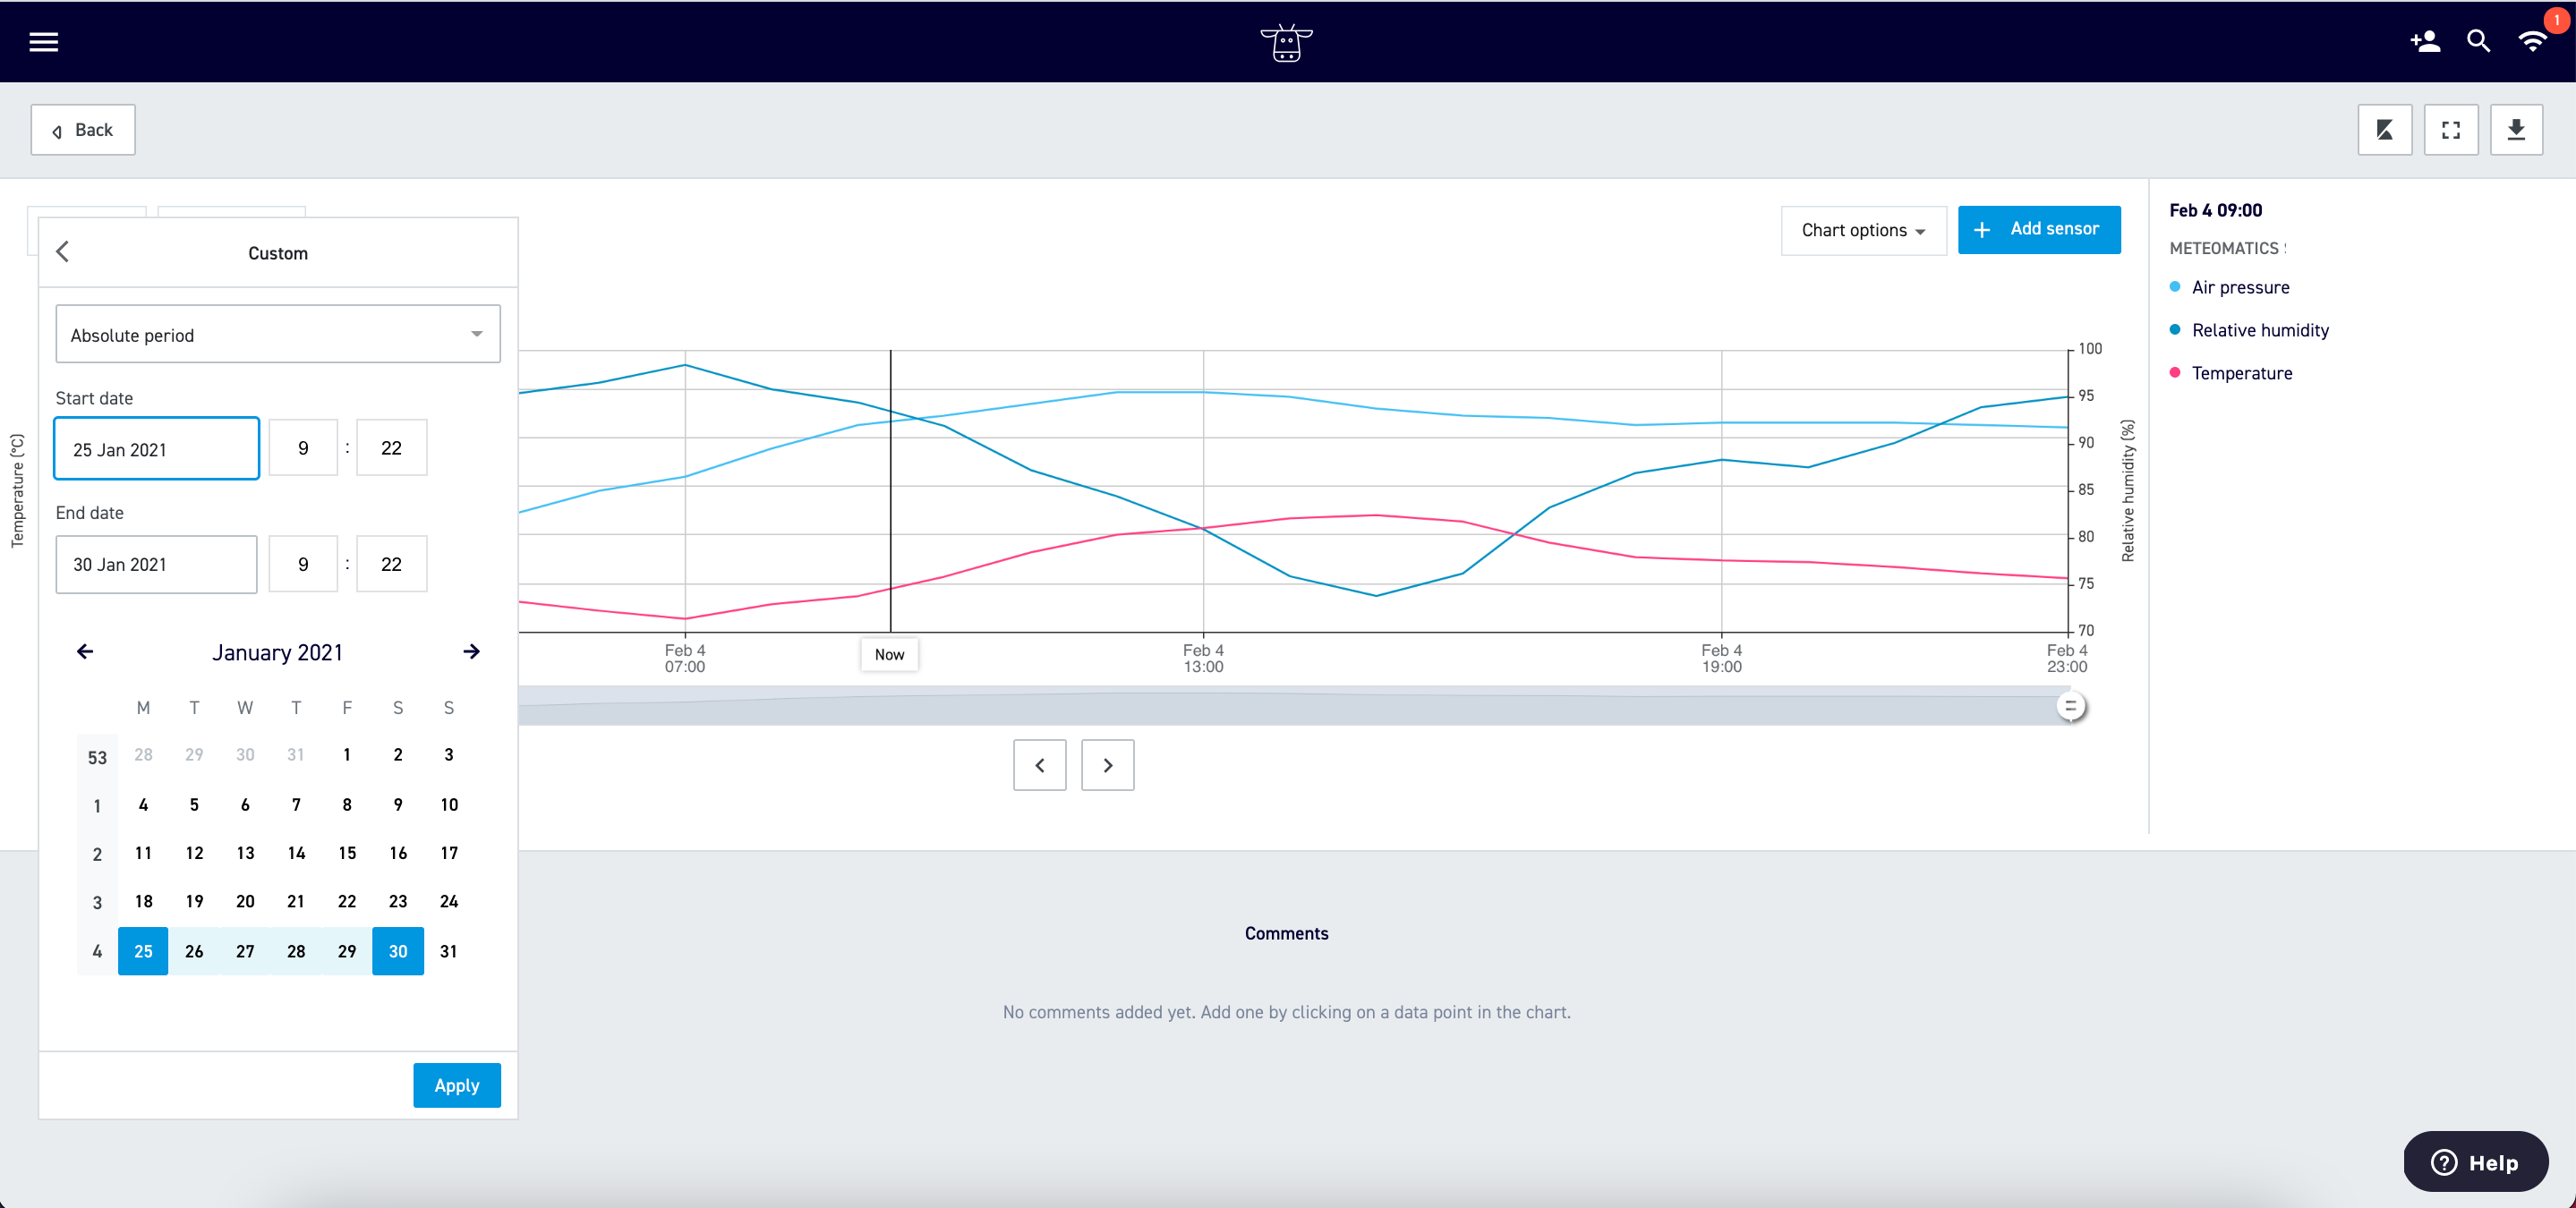
Week numbers in datepicker in Explore
The week numbers are not only visible in the charts. The week numbers are also added to the datepicker within Explore. Now it is even easier to select the correct date!
Plot more data in your charts
Do you have loads of data? Good! Now it's possible to plot more data in your charts. You can add data with a time interval of 1 minute with a period for 45 days. And for a time interval of 5 minutes you will be able to add data for 227 days. This will definitely help you when you are analysing your data in Explore.
New weather forecast provider, Meteomatics!
We have a new weather forecast provider, called Meteomatics. Meteomatics not only provides you with detailed weather forecasts, but also enables you to look 10 days ahead. So we have extended the forecast from 5 to 10 days. We hope this will help you make better decisions.
Do you already have weather forecast data and used the data in widgets? No worries! The new data will automatically be ingested in the widgets that you have visualized with weather data. So there is nothing you have to do, except benefit from the comprehensive weather data.
Learn more what is provided and how you can visualise your weather data into your widgets.