After installing your RTR package, you are ready to set up your RTR application. You’ll need a PAR sensor to measure the radiation, and a Temp-Humidity sensor for the air temperature measurements. If you have these two sensors available in the platform, you can use the RTR application.
Don't have the RTR application yet (side menu, under 'Apps')? Send an e-mail to support@30mhz.com with your organization name and we'll install the RTR application for you.
In this article:
Getting the target temperature
Set up your RTR strategy
The first step for using the RTR application is to define your RTR strategy. This means you'll determine the base temperature, and the temperature increase per 10 mol light.
If you already know your RTR strategy, or you want to use an existing strategy, go directly to the target temperature graph.
Step 1 - Set up the Radiation to Temperature Ratio graph
This graph shows the ratio between the light and temperature based on previous measurements in your greenhouse. Choose a recent period (like last week) or a specific period in which you know you achieved great plant growth results. You will use this period to decide the optimal ratio for different light conditions. Press the 'edit pencil' in the top right corner.
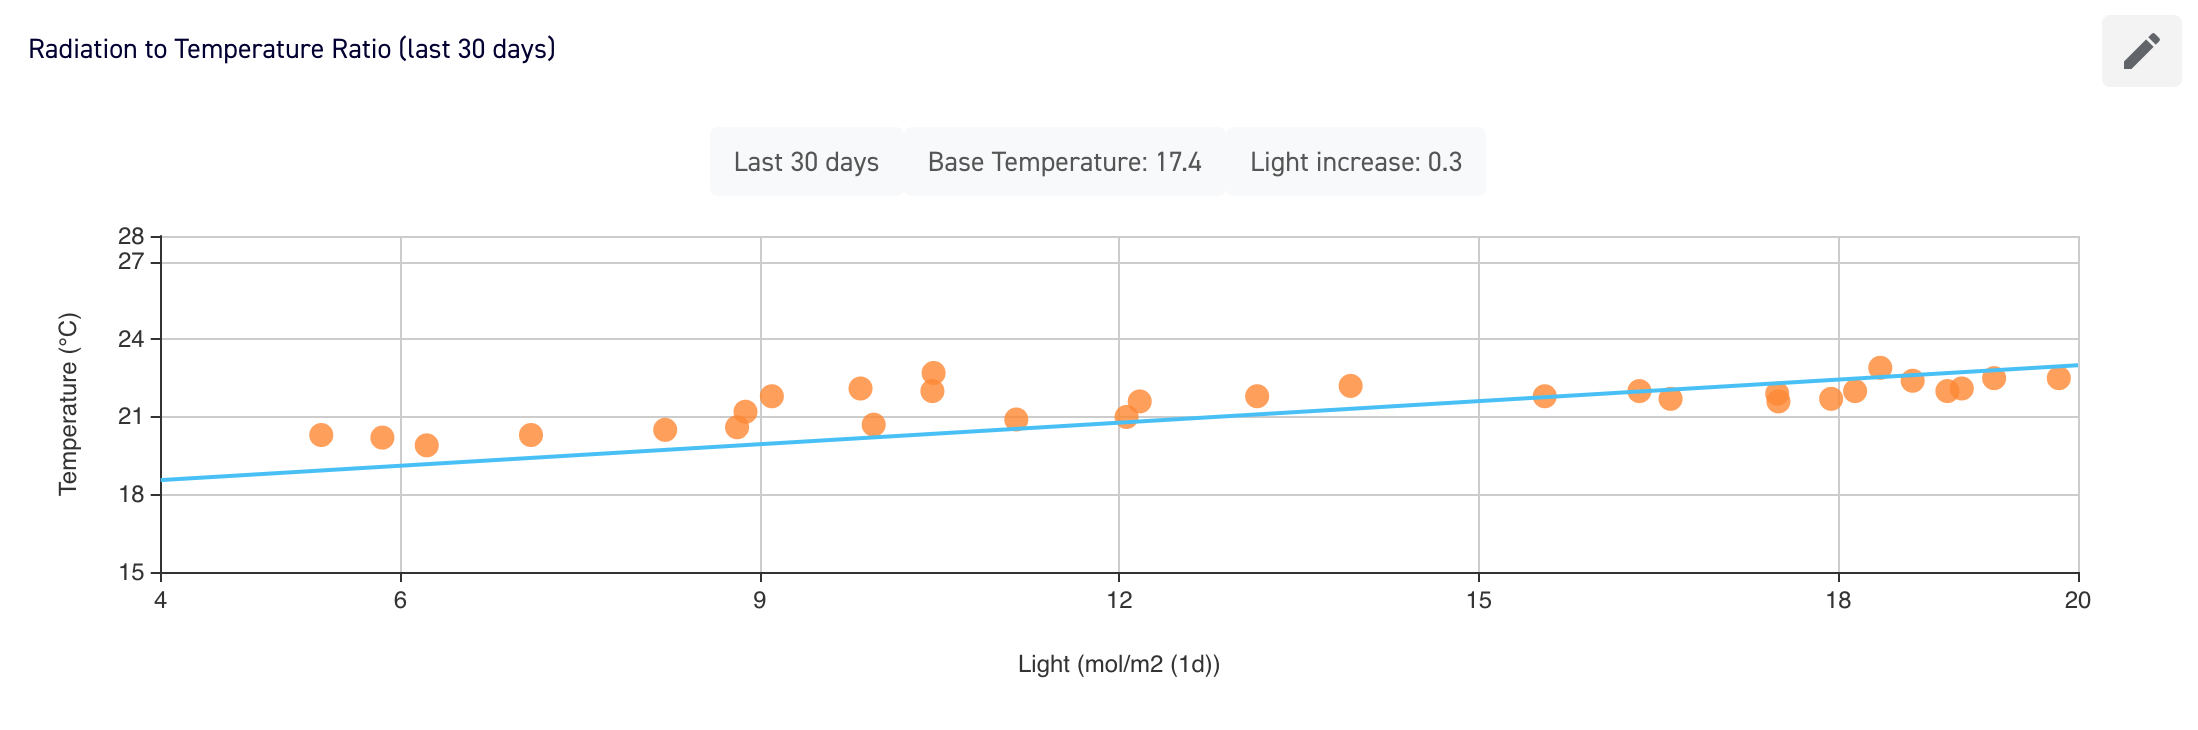
Figure A. End result of the RTR graph.
Step 2 - Select data sources
As data source you use a light sensor and a temperature sensor that are representative for the amount of light/temperature in your greenhouse.
Step 3 - Set the trendline via reference points
Choose two reference points of good light-temperature ratio to define the ratio. This can be points from the graph (see Figure B), or you might know the optimal temperature for different amounts of light yourself.
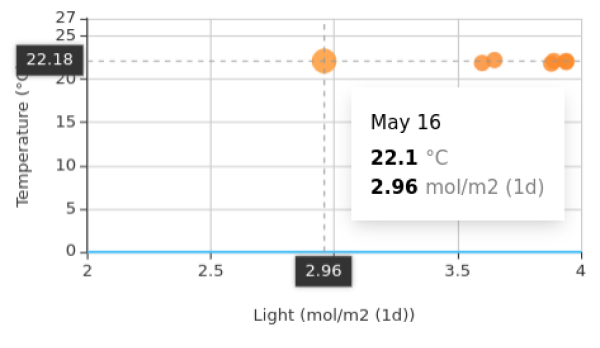
Figure B. Example of taking a reference point from the graph.
You'll fill in the first reference point and the second reference point. As shown in Figure C.
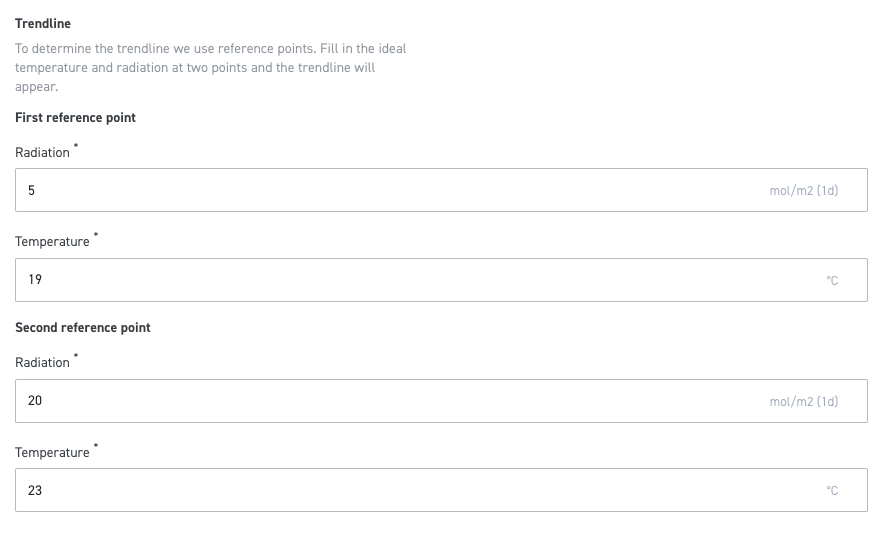
Figure C. Fill in 2 reference points.
Once the two reference points are filled in, the blue line is drawn between these points to define the radiation-temperature ratio. The base temperature and the temperature increase per 10 mol light are noted at the top of the graph. These values define your RTR strategy, and will be used to determine the target temperature. See Figure D for a summary of the RTR strategy.
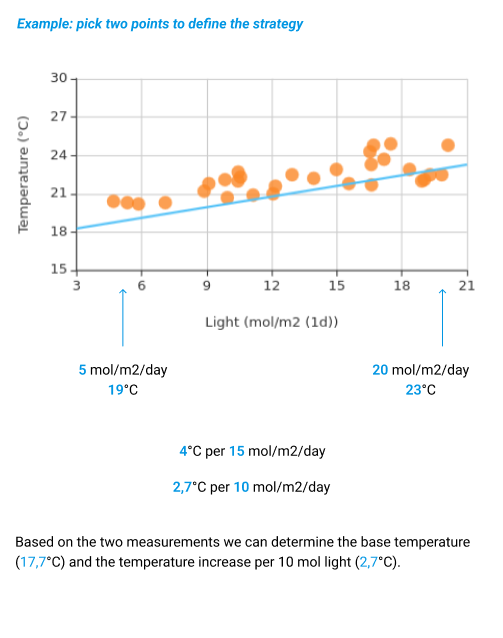
Figure D. Summary RTR strategy set-up.
Getting the target temperature
Based on the RTR strategy defined above, we can determine the target temperature based on the optimal temperature the amount of light per day.
Set up the RTR target temperature graph.
This graph shows the target temperature and the realized temperature in the greenhouse. Select a light sensor and a temperature sensor to use to base the target temperature (and realized temperature) on. Fill in the base temperature and the temperature increase per 10 mol light as determined by the Radiation to Temperature Ratio graph or by your knowledge.
Based on this input the target temperature will be calculated and shown in the target temperature graph, see Figure E. The blue line represents the realized temperature, the orange line the target temperature.
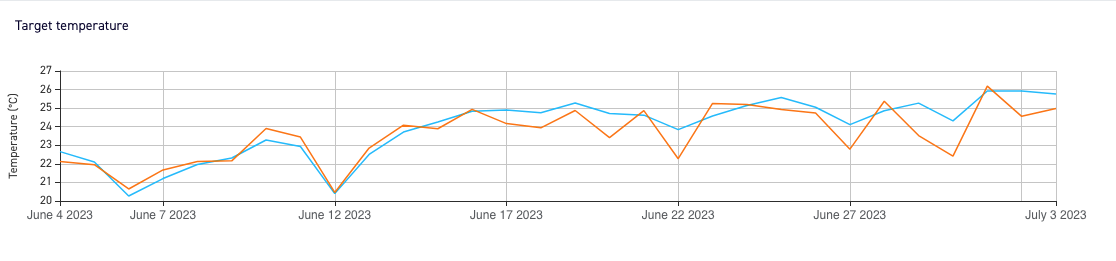
Figure E. Target temperature graph, blue is realized temperature, orange is target temperature
Control and evaluate
Now that the RTR strategy and the target temperature can be calculated, you can work to achieve optimal temperatures in the greenhouse, and evaluate whether you’re deviating from the ideal RTR strategy.
Control
Use the weather predictions and the target temperature from the last week to decide on a target temperature of the day. For optimal plant health, the ideal target temperature adheres to the RTR strategy, but doesn’t fluctuate too much between days for stability.
See the example (Figure F) on how to use the weather prediction of the solar radiation to determine the target temperature for the coming days.
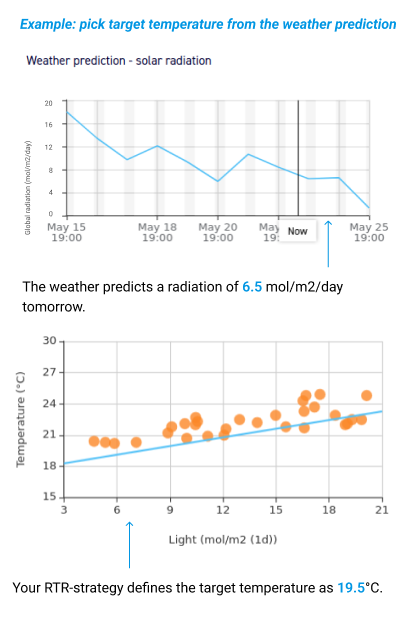
Figure F. Example of using the weather prediction to determine the target temperature
Evaluate
Use the RTR graphs to identify patterns in the relation between the target temperature and the realized temperature.
Realized temperature is consistently too high. Indication of excessive heating or poor ventilation. There might be an opportunity to save resources and prevent heat stress in your plants.
Realized temperature is consistently too low. Indication of insufficient heating or poor insulation. Increasing the temperature or adjusting the light in the greenhouse prevents reduced plant development.