This article explains how to use the Irrigation Management App in the 30MHz platform. This article contains:
Key irrigation concepts that help turn data into information
The Irrigation Management App
Key irrigation concepts that help turn data into information
To help you turn your data into information, we use the following key irrigation concepts in the Irrigation Management App.
Good to know: When we refer to soil and soil moisture throughout this article, please note that we intend this to include substrate and substrate moisture too. 30MHz’s sensors and app are uniquely designed to work for all types of growing media.
Measurements
Soil Moisture is the amount of water present in the soil. It influences plant growth, soil temperature, transport of chemicals and groundwater recharge. One of the most widely used parameters for quantifying moisture levels or water availability for plants is Volumetric Water Content (VWC).
Volumetric Water Content (VWC) is the volume of water divided by the volume of soil. The VWC is the percentage of water in a soil sample. As such, it can be expressed as a percentage (50%), which would mean 50 liters of water per 100 liters of soil.
Moisture thresholds
Moisture thresholds are specific values that indicate the maximum and minimum water holding capacity of a soil or substrate. And that indicates when a crop will start to experience water stress.
Saturation refers to the point at which all the pores (small spaces of air) in between soil granules are full of water. At this point your soil can hold no more water.
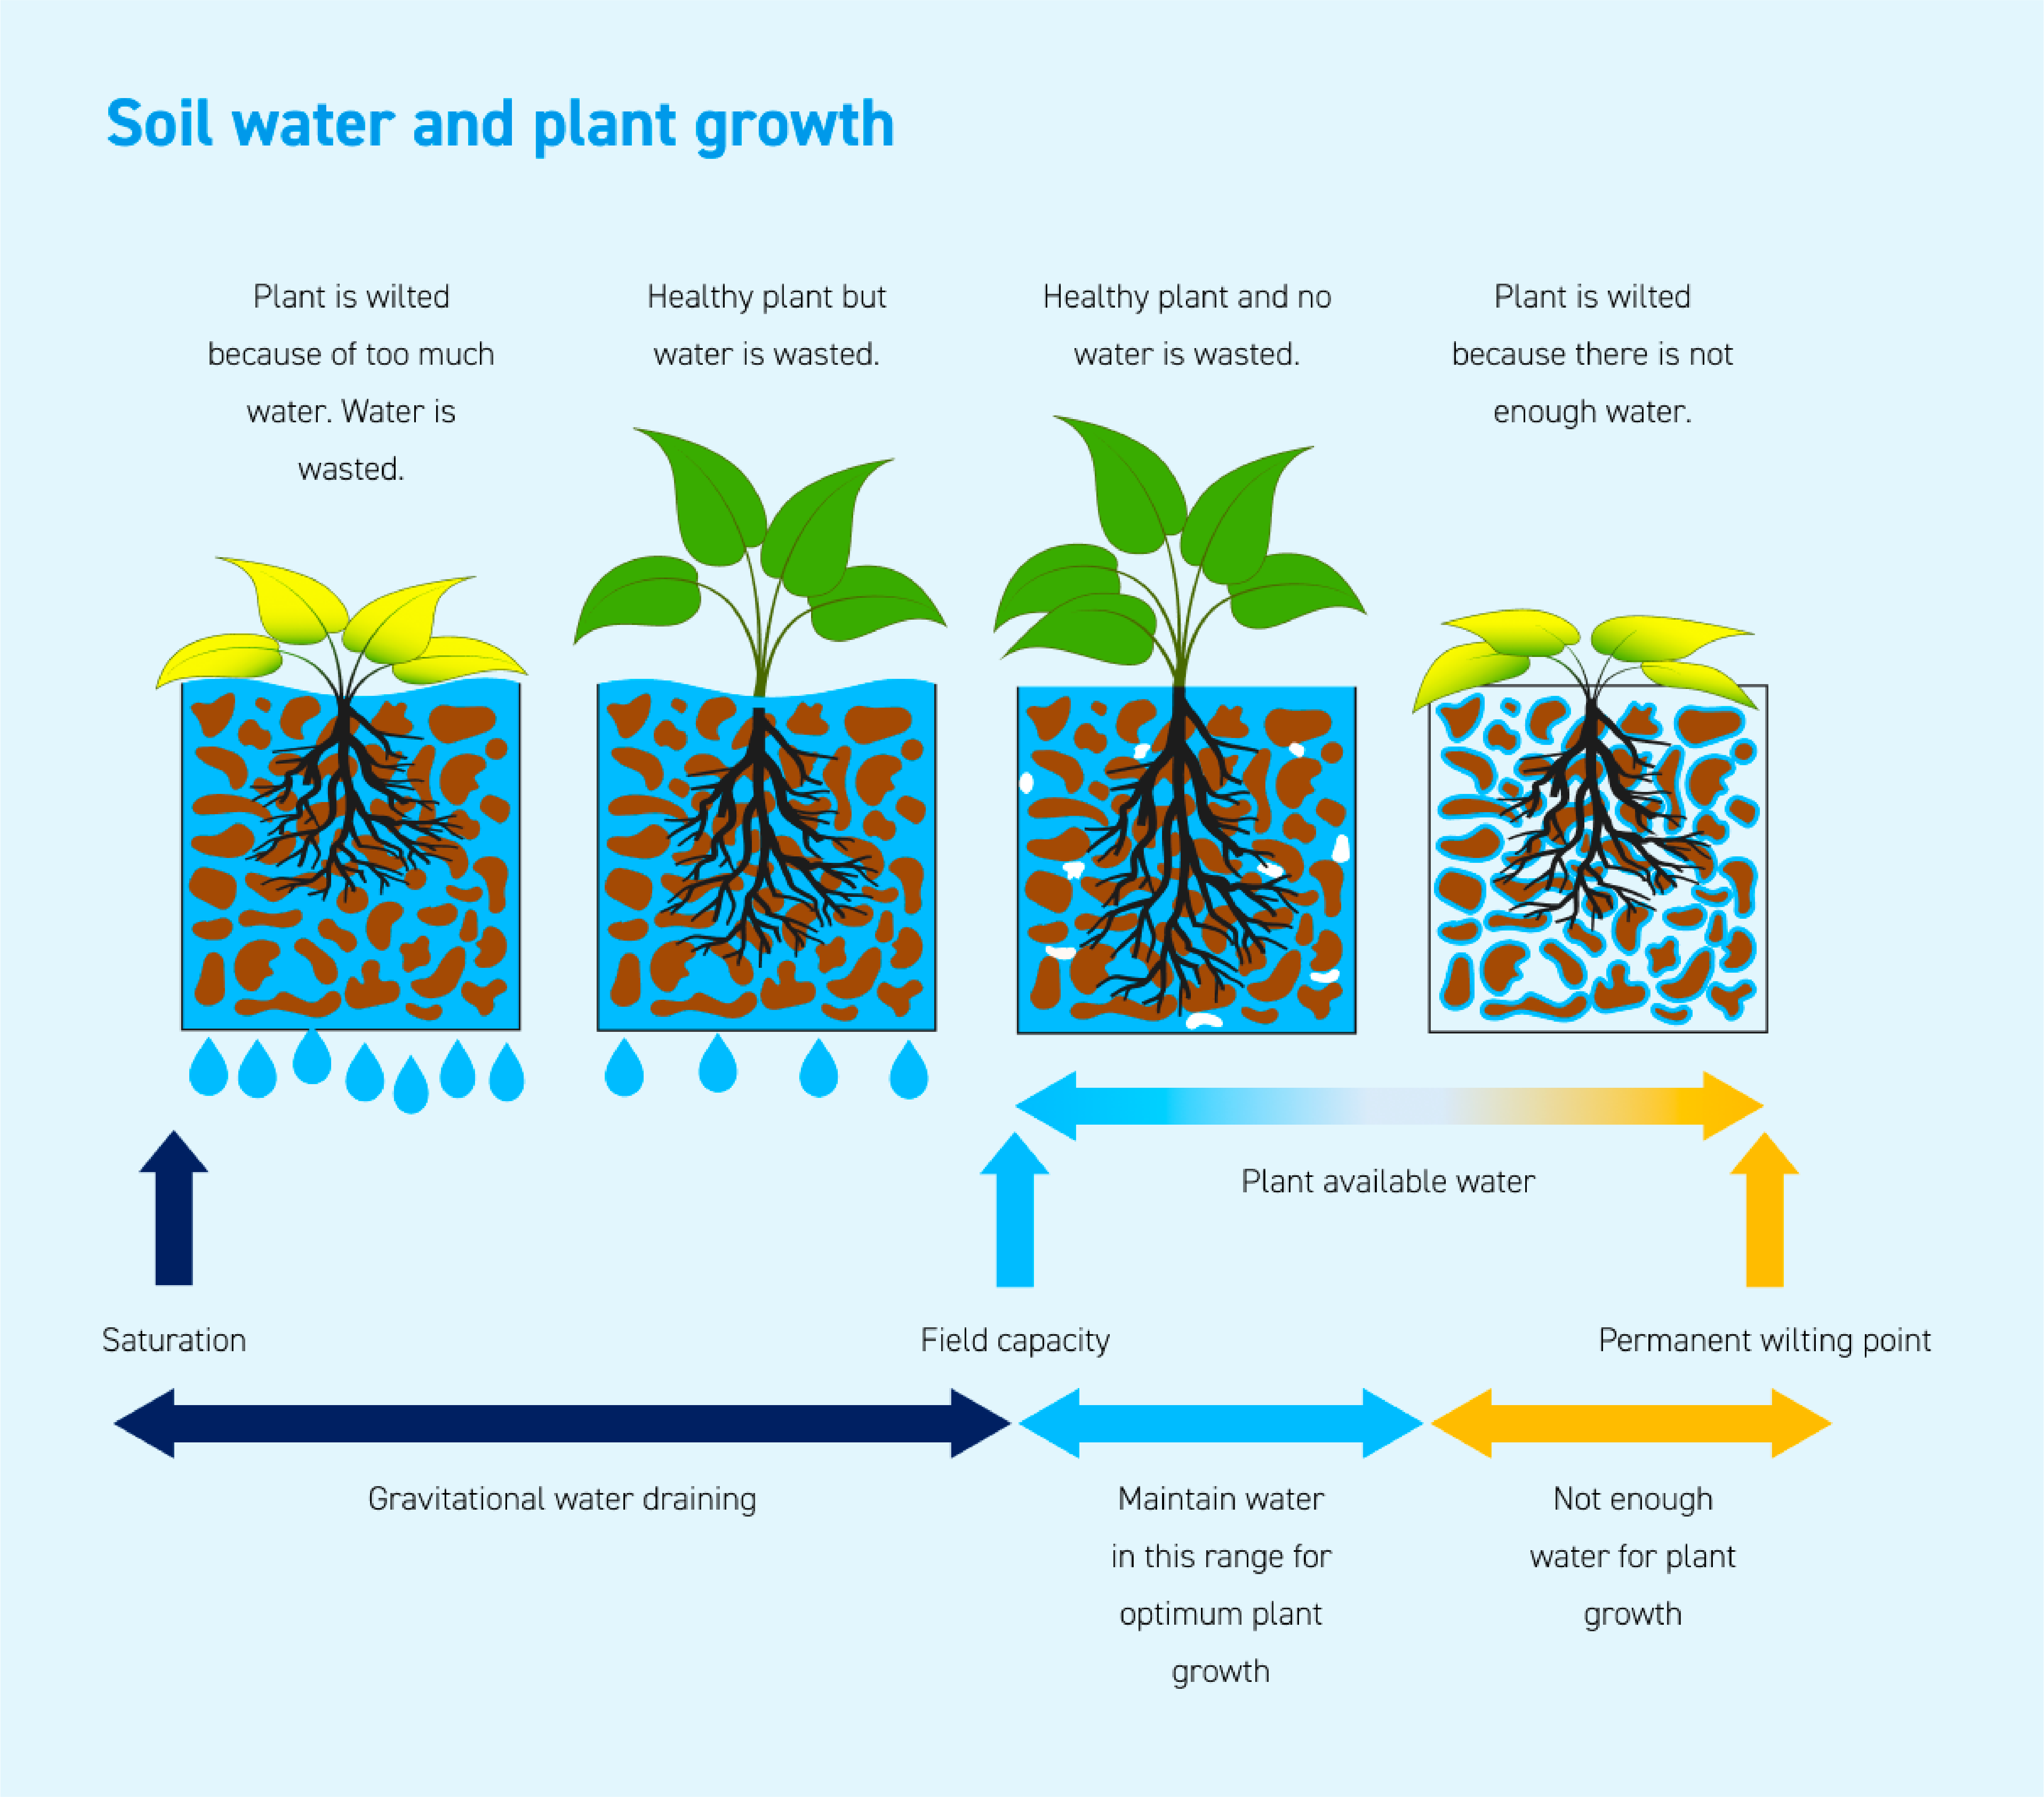
Field Capacity (FC) is the threshold at which water in larger pores has been drained away by the force of gravity. An irrigation strategy that causes moisture levels to go above FC is not desirable, because the additional water will percolate to deeper layers and will not be available to plant roots. Just below FC, the water content of the soil is considered to be ideal for crop growth. Thus, FC is usually considered as the upper limit for irrigation management. FC is a function of soil type.
Permanent wilting point (PWP) is the threshold where it becomes impossible for plants to extract water at a rate fast enough to keep up with their water demand. At PWP, soil particles hold the water so strongly that it becomes difficult for plant roots to extract it. At this limit, transpiration (water use by plants) and consequently other processes vital to plant survival come to a near stop. This causes a significant reduction in crop growth and yield of crops. If moisture levels remains below the PWP for an extended period, the plant will be severely damaged. Irrigation should be applied well before moisture levels starts approaching the PWP. PWP is a function of soil type.
Total Available Water (TAW) is the amount of water your soil can hold that is readily available to your plants. It is the water stored between the two thresholds of Field Capacity and Permanent Wilting Point. In other words, FC - PWP = TAW.
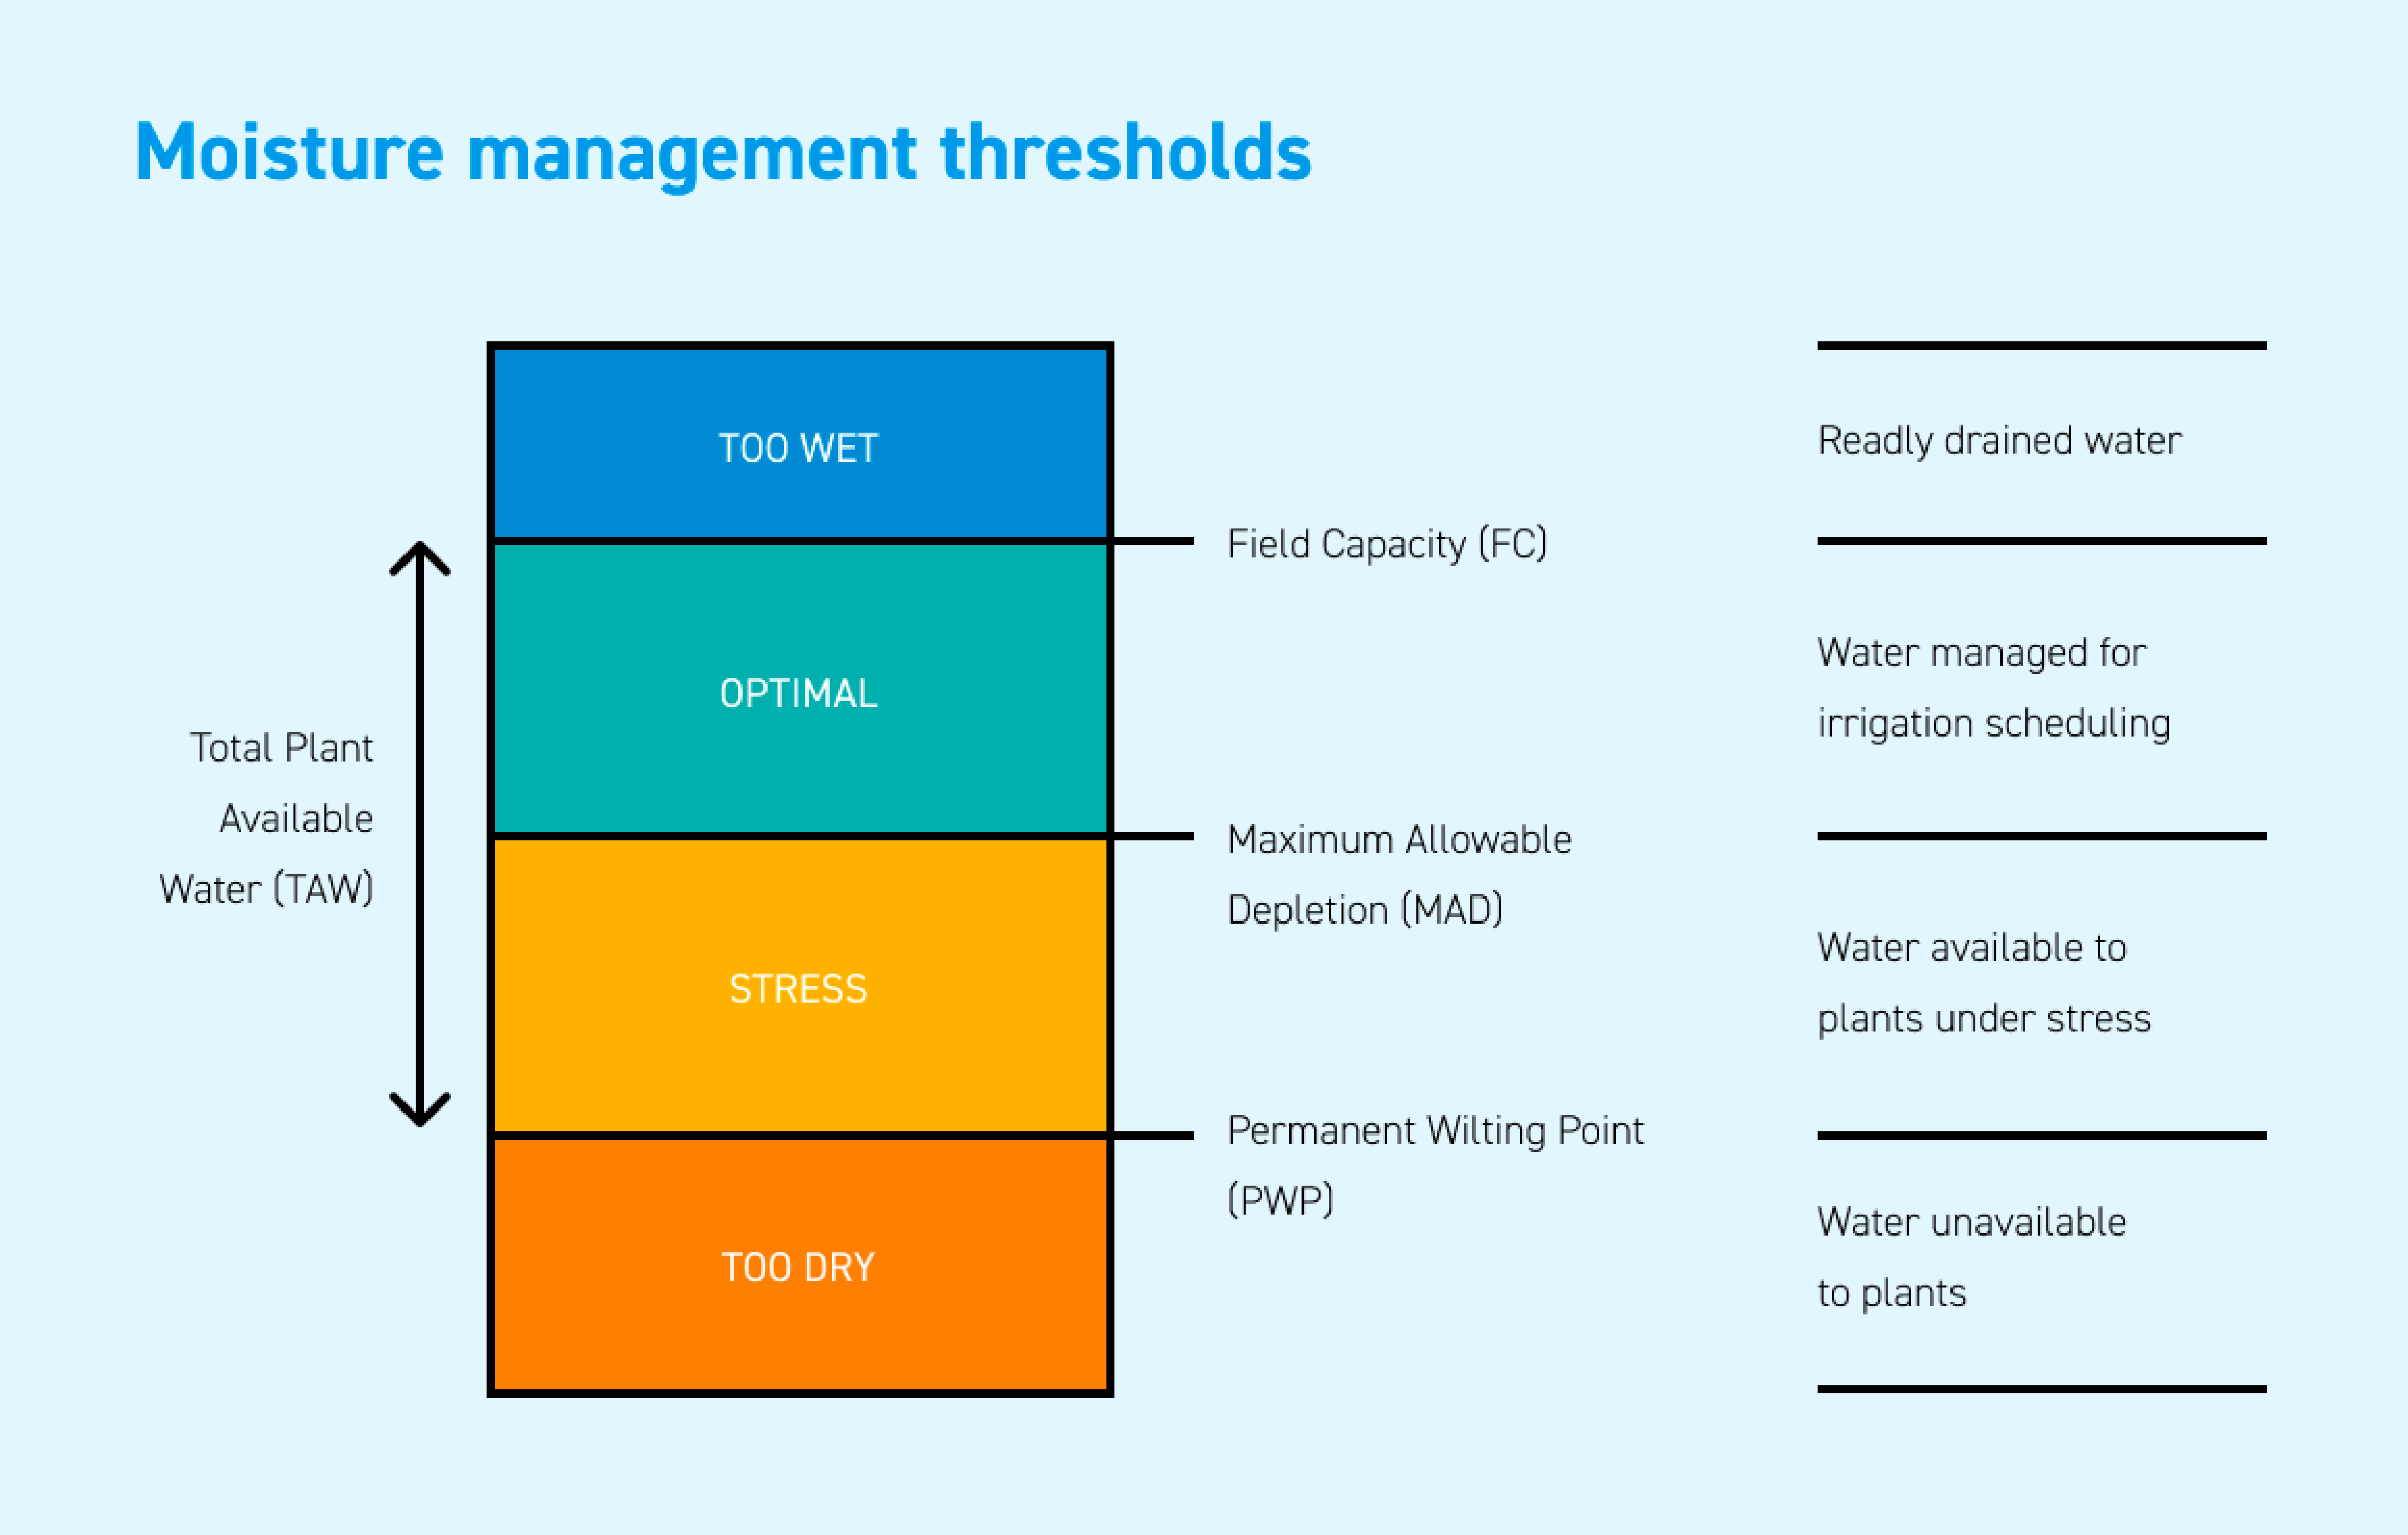
Maximum Allowable Depletion (MAD) is the portion of the total available water (TAW) that can be depleted before plants experience water stress and potential growth reduction (consequently yield reduction). Although plants can extract water across the entire range of TAW, the cost is not the same. If VWC drops below the MAD value, plants begin to face water stress. Think of MAD as the lower VWC limit of the desirable range. The more your actual VWC measurements fall below the MAD limit, the greater the stress crops will experience until PWP is reached and irreversible damage is done. MAD is a function of crop type and growth stage.
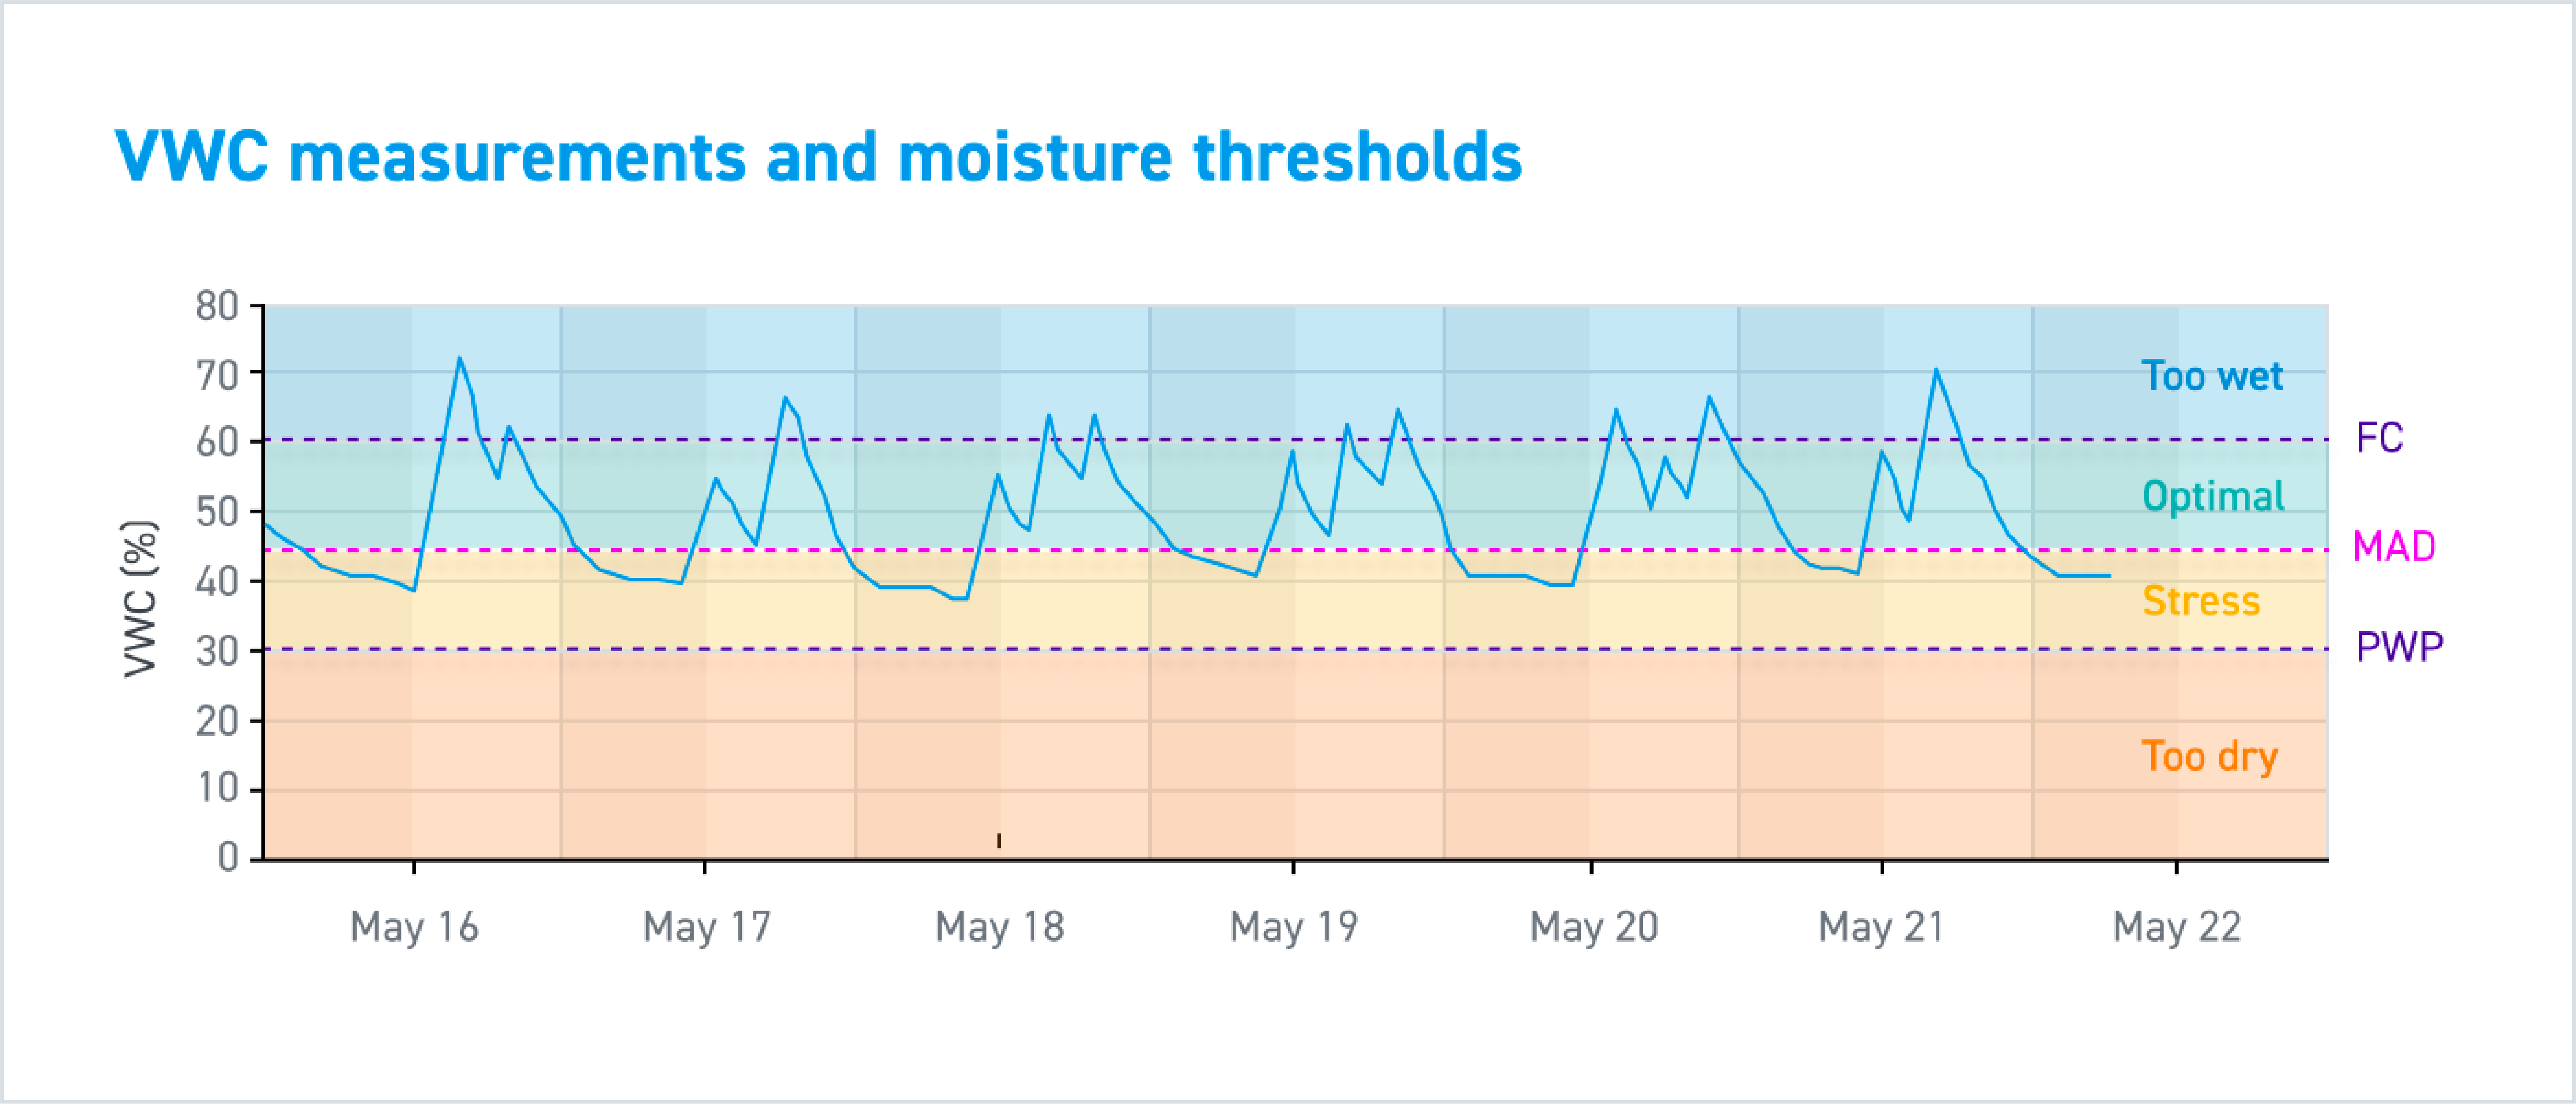
Combining VWC measurements and moisture thresholds can can help you determine when and how much irrigation is needed:
The Irrigation Management App
We recommend installing one 30MHz Irrigation Management Kit (including 4 soil moisture sensors) per valve area. Each valve area gets its own dashboard including average VWC values, FC and PWP limits, an MAD limit, a water registration sheet and water use data, and sensor level VWC and EC values.
Navigation and settings
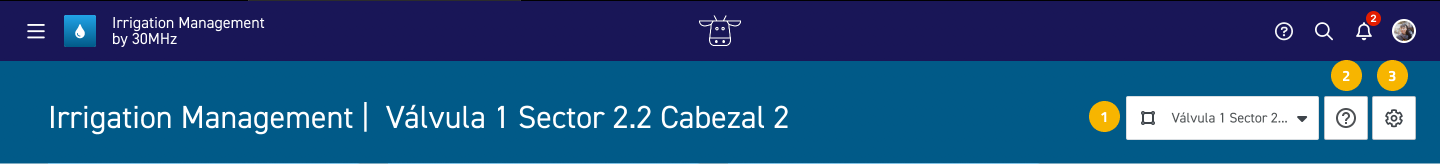
- If you have multiple dashboards for multiple valve areas, you can switch between valve areas with this dropdown navigation bar.
- You can access all the support articles and manuals for the Irrigation Management Kit and App here.
- This is where you can access the app settings to view, change or reset the information you select and fill in when you first set up the app. This is the information that makes the dashboard work for you and provides valuable insights for your specific situation.
Key insights
At the top of the Irrigation Management Dashboard there are three boxes that offer you a quick and easy overview of key information about your irrigation practice.
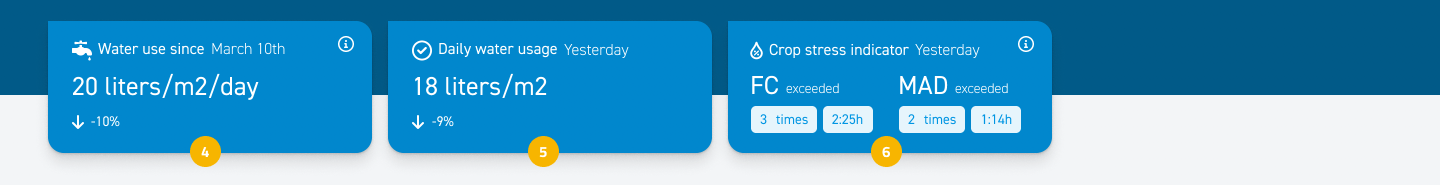
4. This shows how much irrigation water (l/m2/day) has been used since the start date, based on your daily water usage data entry in the registration sheet, compared to the estimated average daily water usage for the growth season. You can find and adjust your start date and estimated average daily water usage in the app settings.
5. This shows how much irrigation water (l/m2) has been used the day before, compared to the estimated average daily water use.
6. This shows the amount of times and the duration that the average VWC value has exceeded the upper VWC limit (Field Capacity, FC) and lower VWC limit (Management Allowable Depletion, MAD) in the past 24 hours. Which gives an indication of the stress levels of your crops. You can find all VWC limits in the app settings.
Average soil moisture and water usage
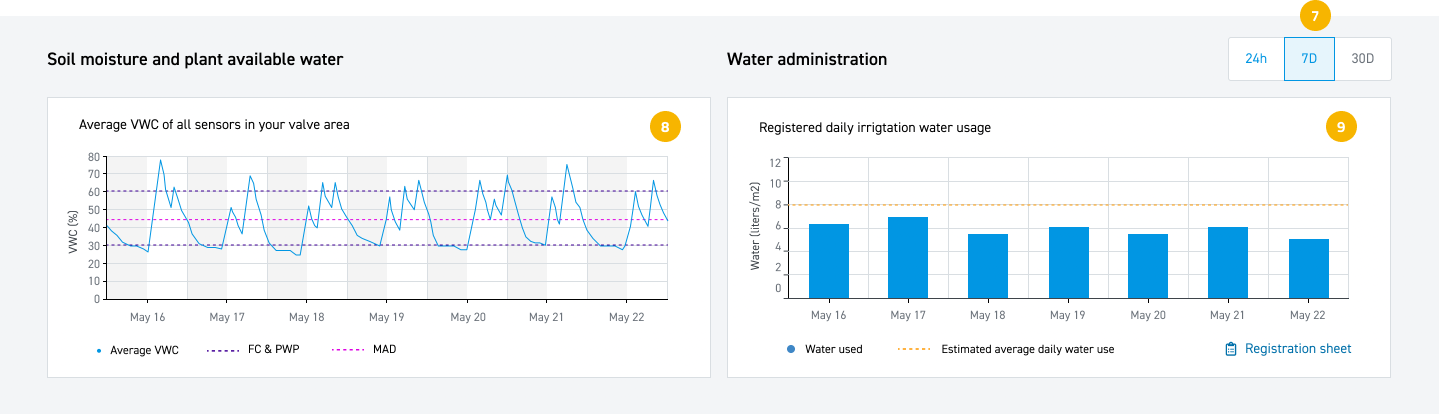
7. Select the desired time range for your dashboard here - the default is 7 days.
8. This line chart displays the average VWC measured by the sensors in this valve area. The line chart also includes the FC and PWP limits (purple lines) and the MAD limit (pink line) to help you keep VWC levels within a desirable range. With the help of this chart, you can evaluate and improve your irrigation strategy for your valve area.
9. This bar chart displays how much irrigation water is administered (liters per m2). In the Registration Sheet (linked in the chart) you can fill in your daily water use per day or per watering session. There is a horizontal line in the chart that displays the estimated average daily water use for the entire growth season. This value is filled in during the first set up of the app and can be viewed and changed in the app settings. With the help of this chart, you can keep track of the actual irrigation water usage and savings.
Sensor level data
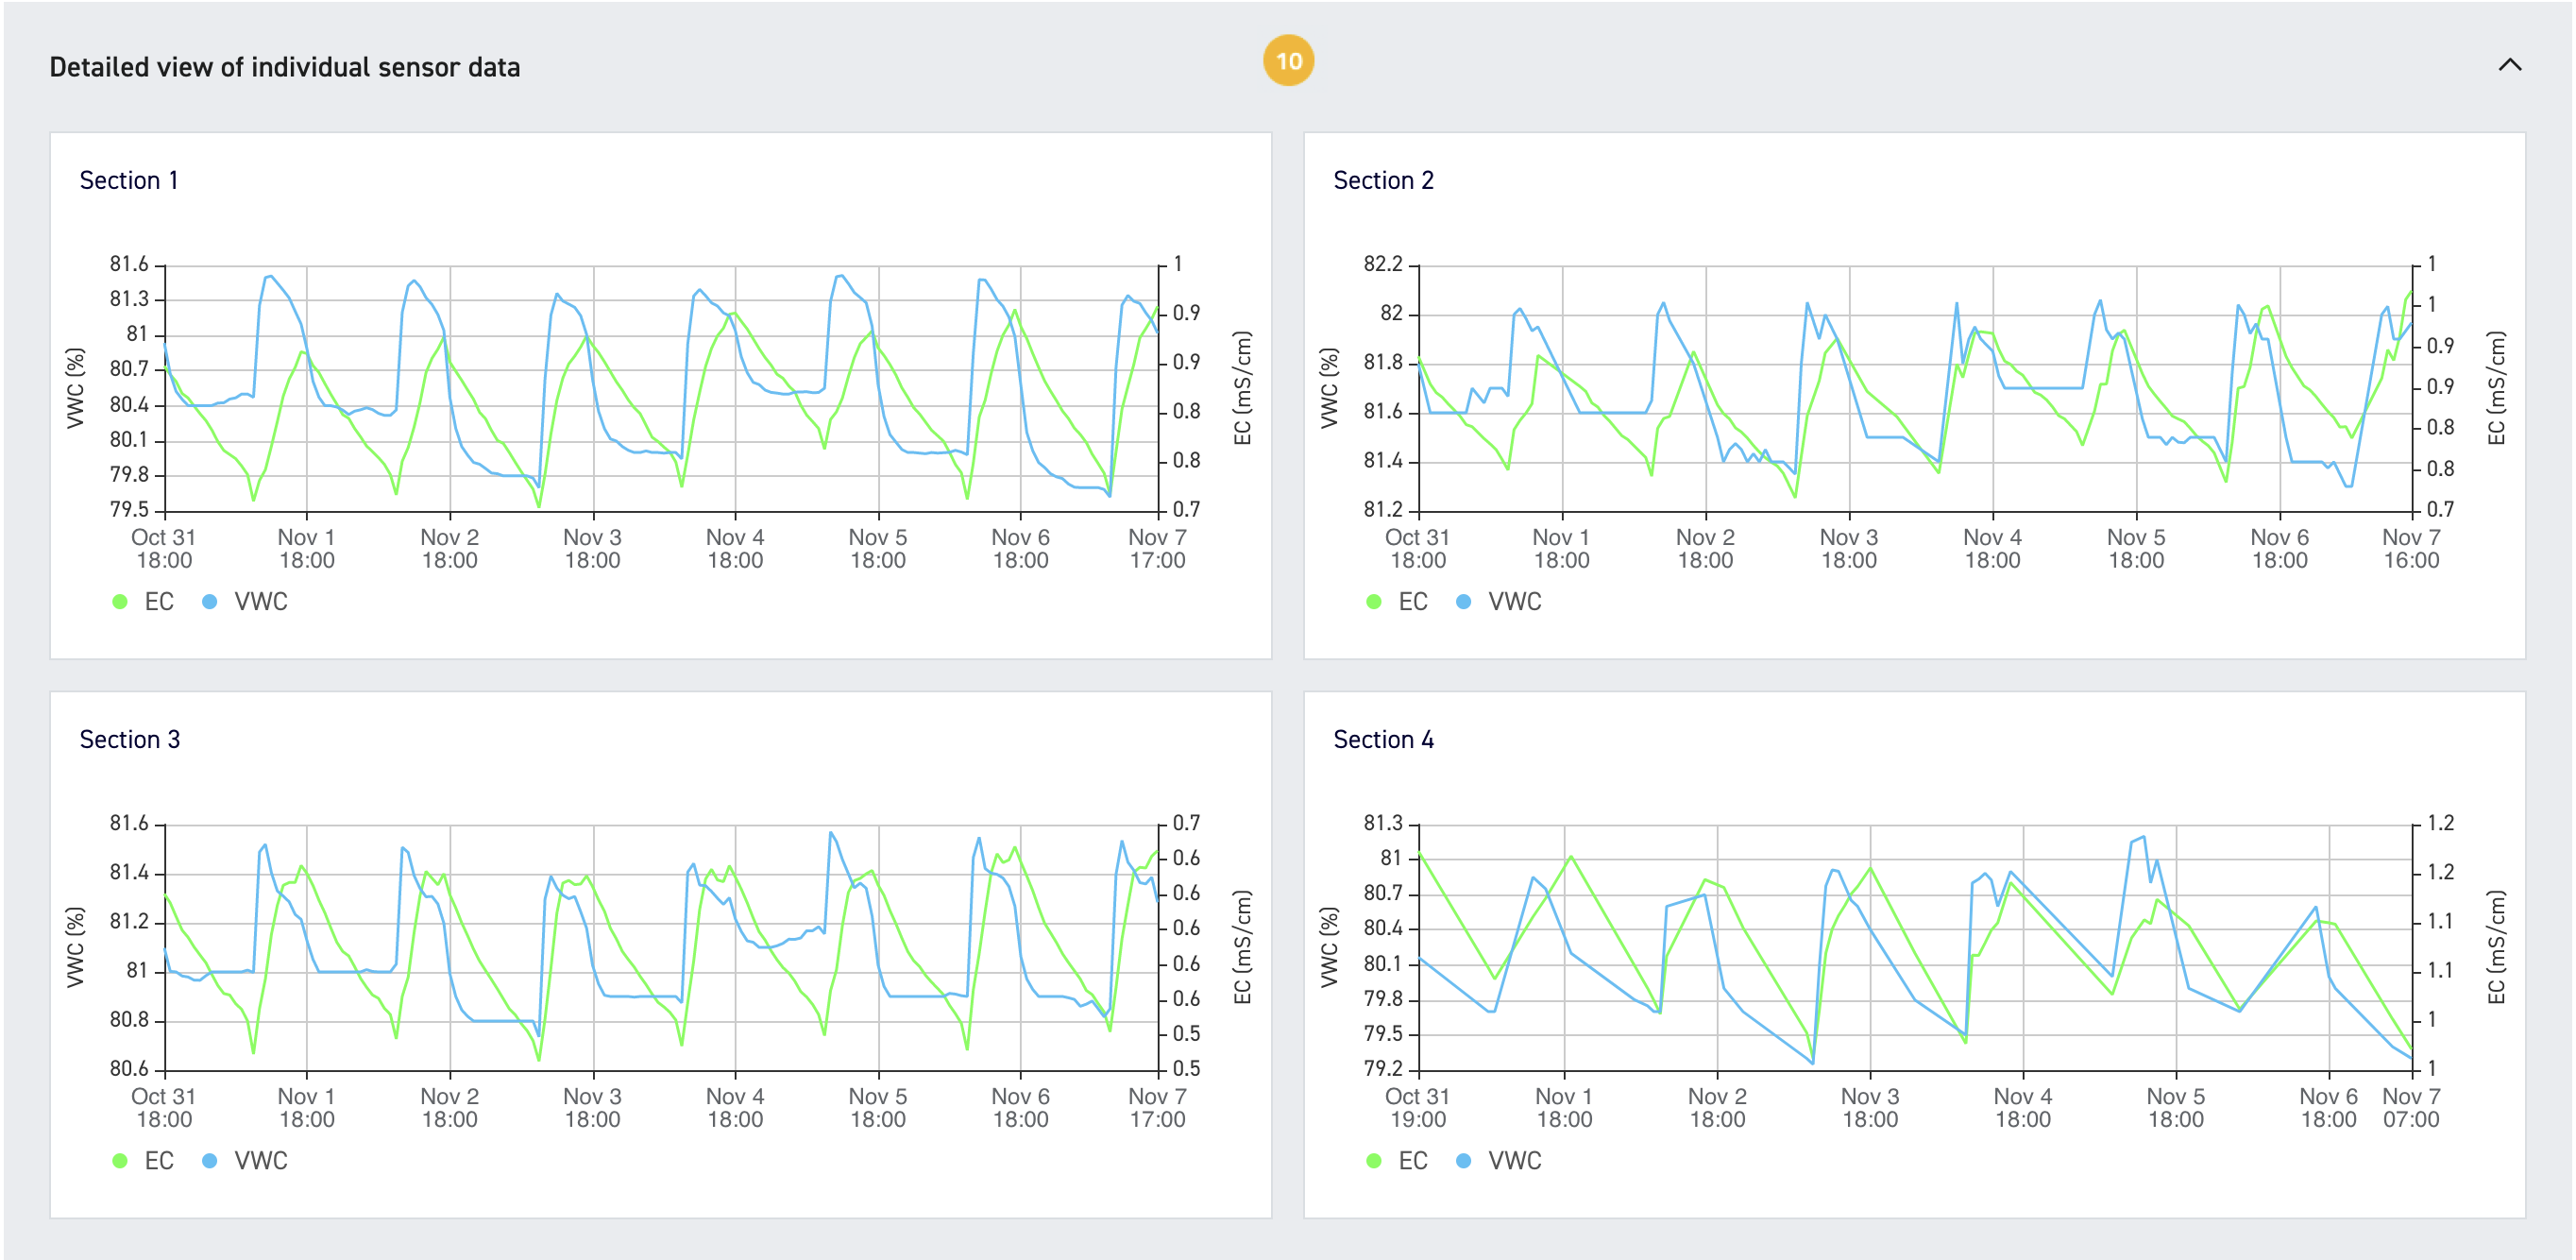
10. This section of the dashboard contains line charts that show the measurements of the individual sensors in your valve area. The charts display the VWC and EC (Electrical Conductivity - a measure of the “total salts” concentration in the nutrient solution) measurements from each of the sensors that are connected to the dashboard. You might not need these charts on a daily basis, but it could be relevant to dive into sensor level data whenever you see irregularities in the average VWC measurements or if you wish to see how your irrigation strategy impacts EC levels.
Irrigation alerts
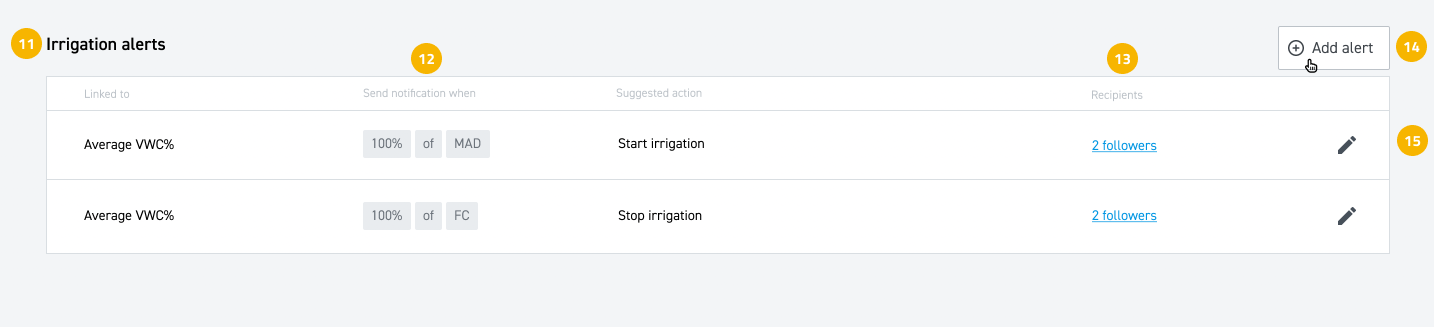
11. At the bottom of your dashboard you can set irrigation alerts based on soil moisture depletion by plants, to stay within a desirable range. During the initial setup of the app, two alerts will be automatically added to your dashboard. These alerts are linked to the following actions: “Start irrigation” and “Stop irrigation”. The alert value for the action “Start irrigation” is based on the MAD value, which is considered as the lower VWC limit. The alert value for the action “Stop irrigation” is based on the FC value, which is considered as the upper VWC limit.
12. When the notifications are set at 100% of the MAD and FC values, you will receive alerts when the average VWC level in your valve area reaches these exact values. If you wish to receive alerts before the average VWC level reaches the MAD and FC values, you can change the percentages.
13. You can add users from your organisation as followers to irrigation alerts. They will then receive these notifications and are able to take action on the alerts if needed.
14. If you wish to add new alerts, you can do this here.
15. You will be able to edit existing irrigation alerts here.
Questions? Please get in touch or view the other Irrigation Management Kit articles here.