Growing degree units already is a proven concept. What is new however, is that you can now view this metric in real-time on the 30MHz platform. Even if you are in the middle of a crop walk. And you can combine this information with the insights of all your other crop level data.
In this article we explain the following subjects:
How to calculate Growing Degree Hours and Days?
How to use the Chill units?
How you set up the GDU/Chill Hours widget
How to calculate Growing Degree Hours and Days?
GGH or GDD are calculated based on temperature and used to predict the development of plants or insects. This way you can estimate when your crop will be in bloom or assess how pests or your IPM is developing. You basically optimize the timing of your crops or biological pest control.
We use a threshold value when calculating degree units. The threshold value is the temperature below which you do not expect crop development. This threshold value is specific to a crop or pest. For degree hours you use the average temperature of one hour. For degree days you use the average 24-hour temperature. You subtract the threshold from the average temperature for the calculation, if it is 0 or lower you have 0-degree units. If your average hourly temp is 2 degrees above your threshold, you have 2-degree hours, and at 10 degrees above the threshold, you have 10-degree hours. Those degree hours are added together.
You can imagine that this can lead to a difference especially on clear cold nights during spring: if you use the average temperature of a 24-hour period, you may not exceed your threshold value. If you now calculate the average temperature per hour, you will see that you do not reach the threshold at night, but a number of sunny hours in the middle of the day can indeed exceed the threshold.
If you already work with degree days and have experience with this, we advise you to continue with this. If you are going to start using growing degrees now, degree hours are easier to use and interpret because it is more accurate so we advise using these instead.
How to use the Chill units?
In the widget, you will see that there is also an option for chill units. Here the threshold is not a lower limit, but an upper limit. You add the period below the threshold value here. Chill Units (CU) are generally used for fruit trees and flower bulbs. Fruit-bearing trees need a period of cold weather after which a fruit-bearing tree will blossom (also known as a vernalization requirement). This is also the case for flower bulbs, which need a cold period before sprouting or blooming. Fruit trees need to spend a specific amount of hours below a threshold temperature to break dormancy so they will flower and set fruit normally.
Chill units is the calculation of the period of cold temperature exposure. The calculation of chill hours in our dashboard is done by counting the hours below a certain threshold. [note, GDH counts the hour times the temperature above a threshold, CU counts the hours below a threshold] During the cold temperatures the plant and flower buds are in a dormant state until they have accumulated sufficient chilling units (CU). When enough CU has accumulated, the flower buds are ready to grow in response to high temperatures.
How you set up the GDU/Chill Hours widget
Do you not have access to the Growing Degrees widget? Please get in touch with us to get you up and running.
So, when you have access to the GDH widget you can take the following steps to create your own:
- Go to one of your dashboards
- Click on Add widget
- Scroll down and click on Growing Degree Units & Chill Hours
- Fill in what you would like to calculate and fill in your title. The default setting is Growing Degree Hours. If you prefer to calculate Growing Degree Days or Chill hours, you can adjust this setting in the first field: What do you want to calculate?
- Select the data source that you would like to calculate with.
- Fill in the start date of the calculation and the threshold base temperature.
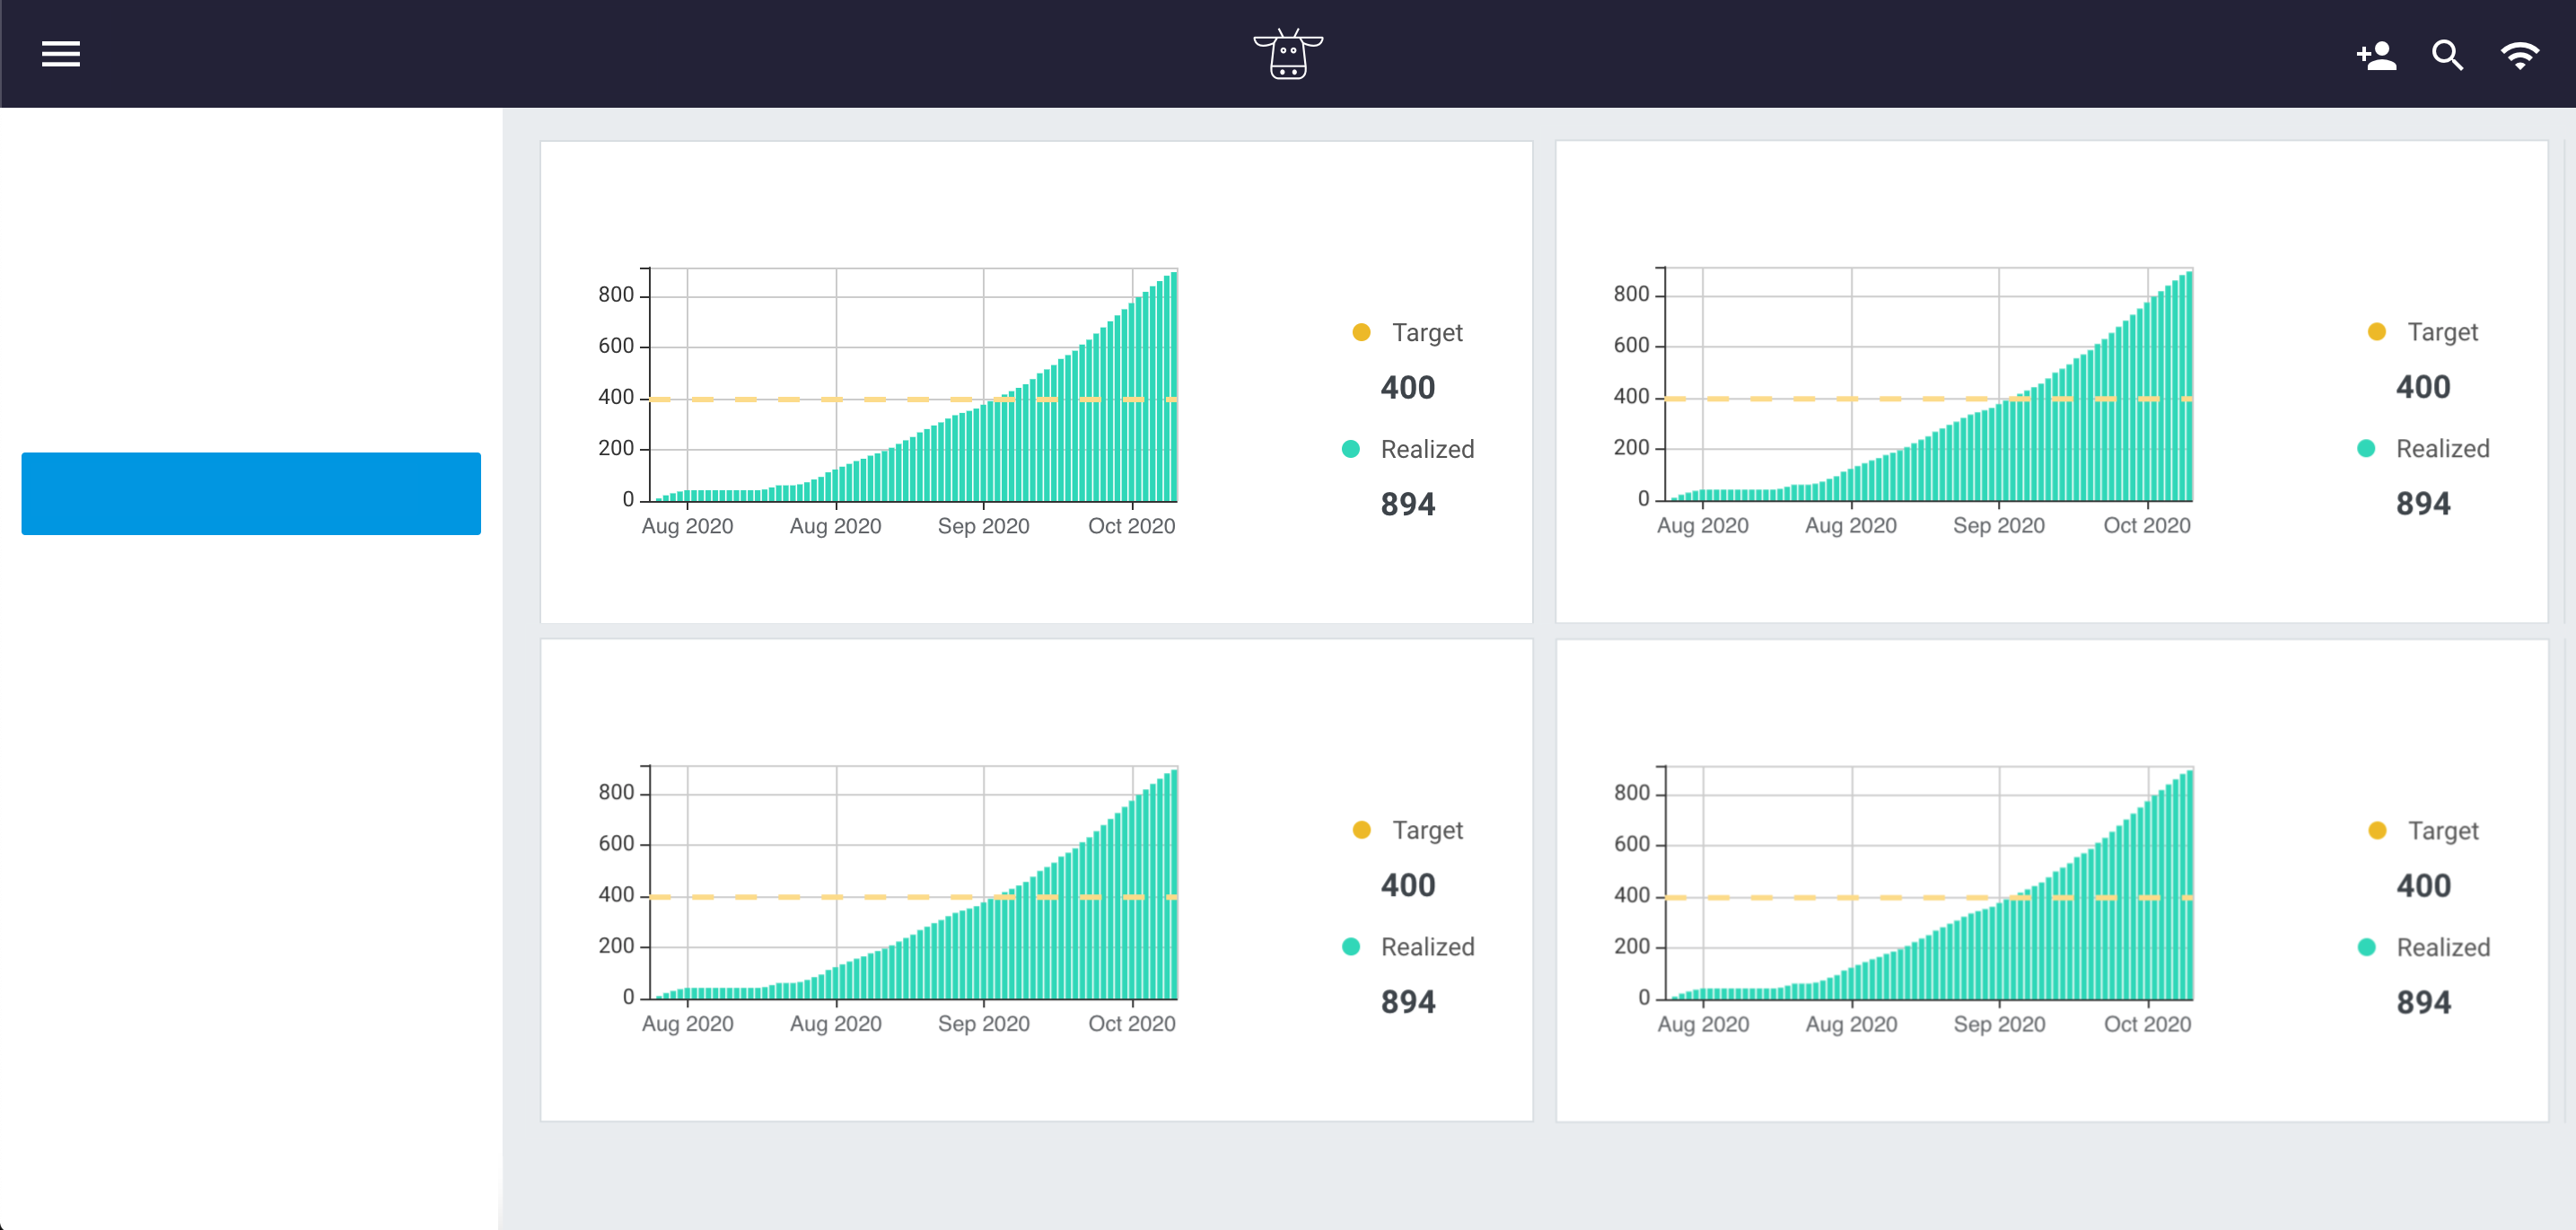
- The last step is to add the target that you would like to reach and click on Create to save the widget.
Click here if you would like to see our colleague Mirjam Bekker explaining how to create this widget.