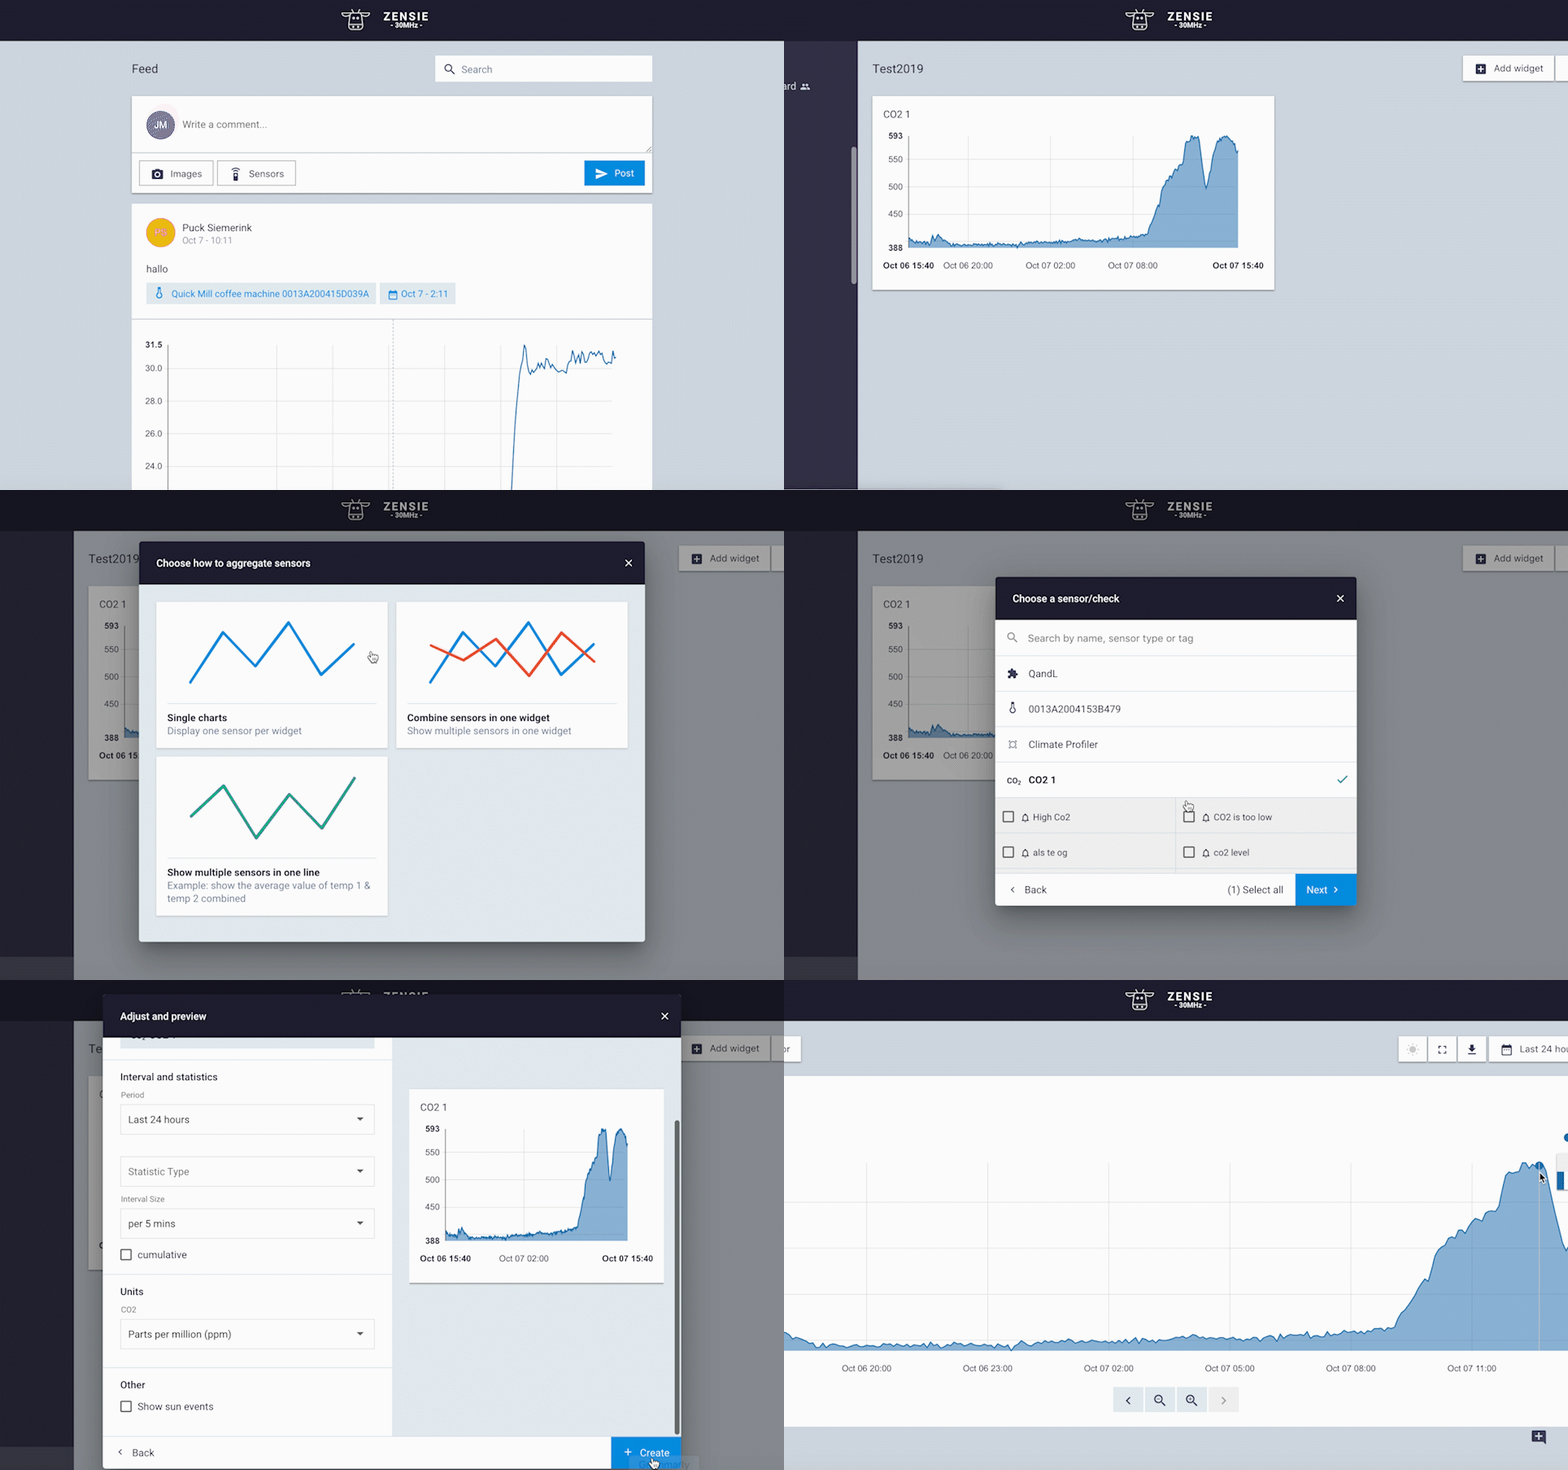
How to create a line chart
Chart widgets contain graphs with multiple data points for a selected time frame. You can create a chart widget for a single check, or you can create a chart widget for multiple checks.

- Go to Dashboard in the main menu.
- Choose the dashboard you would like to add a widget to.
- Click on the + Add widget button.
- Choose Line chart as widget type.
-
Choose how you want to aggregate your sensors
-
Choose a sensor or check you want to read in the widget and click Next
-
Adjust all options as you please, preview your widget on the right. If you’re happy, click on + Create