It is possible to show the sunrise and sunset in graphs. Before you are able to do this, you need to fill in your location coordinates at the organization settings from your dashboard.
Add the coordinates:
- Go to Account settings in the main menu
- Go to the tab Organisation
- Scroll down till you find the field latitude and longitude
- Fill in the latitude
- Fill in the longitude
- Scroll further down till you find the Save button
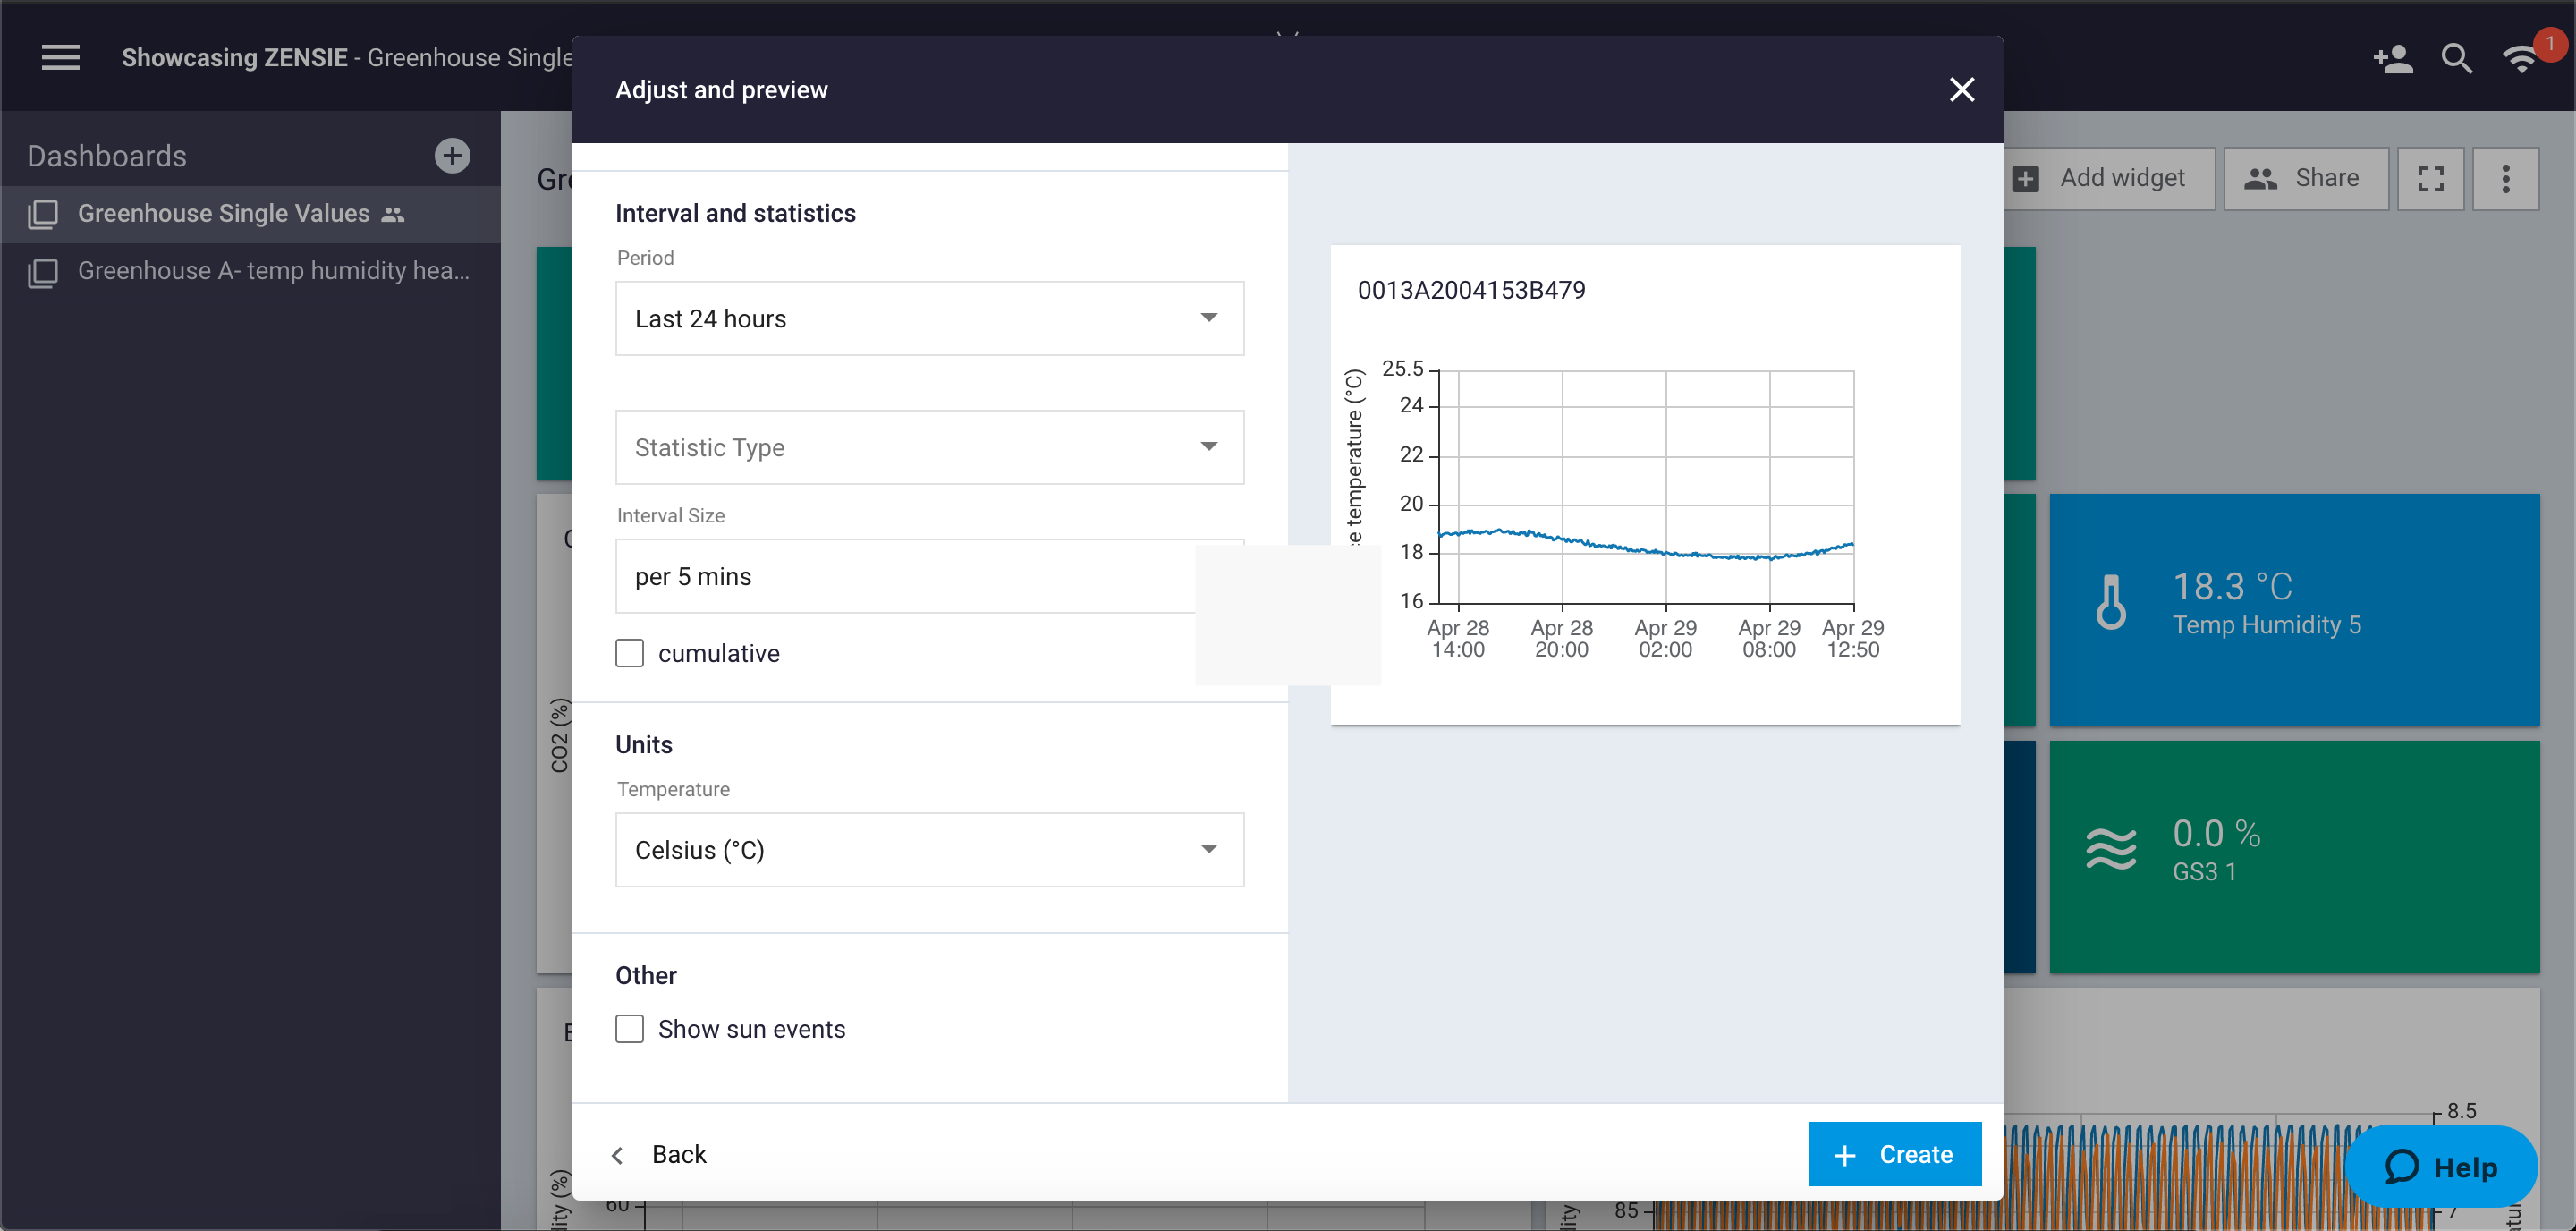
When the coordinates are added, you are able to show the sunrise and sunset events in your graphs. When creating a graph widget, you can activate the sun events in the settings at Other, show sun events.
In Explore you are able to show the sunrise and sunset events as well by changing the chart options. Click on Chart options and activate Sunrise and Sunset.
Watch the video to add the sunrise and sunset events in your graph with Explore.